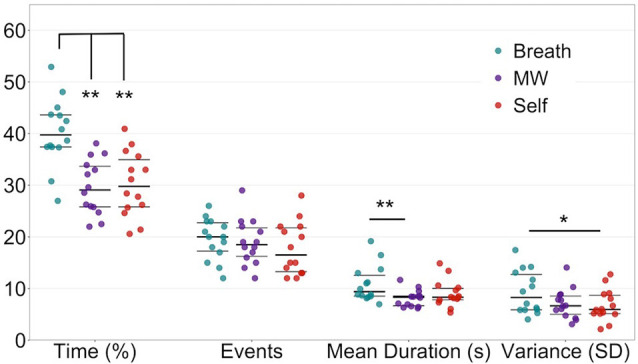
Figure 5.

EMBODY Step 3: quantification and mental state profiles of internal attention during meditation. Based on the estimate of mental states and event specification from Step 2, metrics of attention during breath meditation were quantified for each mental state and initially characterized at the group level: percentage time spent in each mental state (Breath, MW, or Self), the number of events, mean duration of events (s), and variability (standard deviation or SD) of the duration of events. Overall, participants spent more time attending to the breath vs. MW or self-referential processing. Beeswarm plots present each data point, the median (bold black line), and ±25th percentile range (gray lines). See Supplementary Table S7 for full metric statistics. *paired t(13) = 2.46, p = 0.029, after one-way ANOVA F(2,12) = 4.20, p = 0.026. **paired ts(13) ≥ 3.18, ps ≤ 0.007, after one-way ANOVA Fs(2,12) ≥ 6.47, ps ≤ 0.005.
