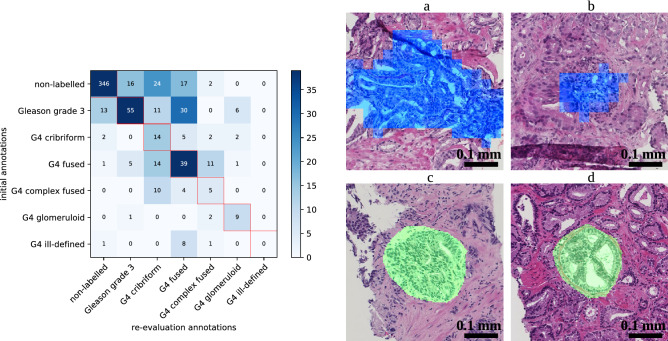
Figure 4.
(left) Confusion matrix showing initial label versus first label during re-evaluation attributed by the pathologists to false positive and false negative patches. (right) Example false positive and false negative cases re-evaluated by the pathologists. Blue indicates a false positive detection and green indicates a false negative annotation. (a) False positive patch initially annotated as ‘fused’ and given ‘cribriform’ as the first label during re-evaluation. (b) False positive patch initially annotated as ‘fused’ and given ‘complex fused’ as the first label and ‘cribriform’ as the second label during re-evaluation. (c) False negative patch initially annotated as ‘cribriform’ and ‘fused’ during re-evaluation. (d) False negative patch annotated as ‘cribriform’ both during initial annotation and re-evaluation. Observe that the automatic segmentations (top) are coarse because the output of the neural network is 32 times smaller than the input; annotations (bottom) were manually drawn on the originals and are therefore smoother.

