
Figure 7. PHGDH inhibition promotes the DNA damage response in a low-serine environment.
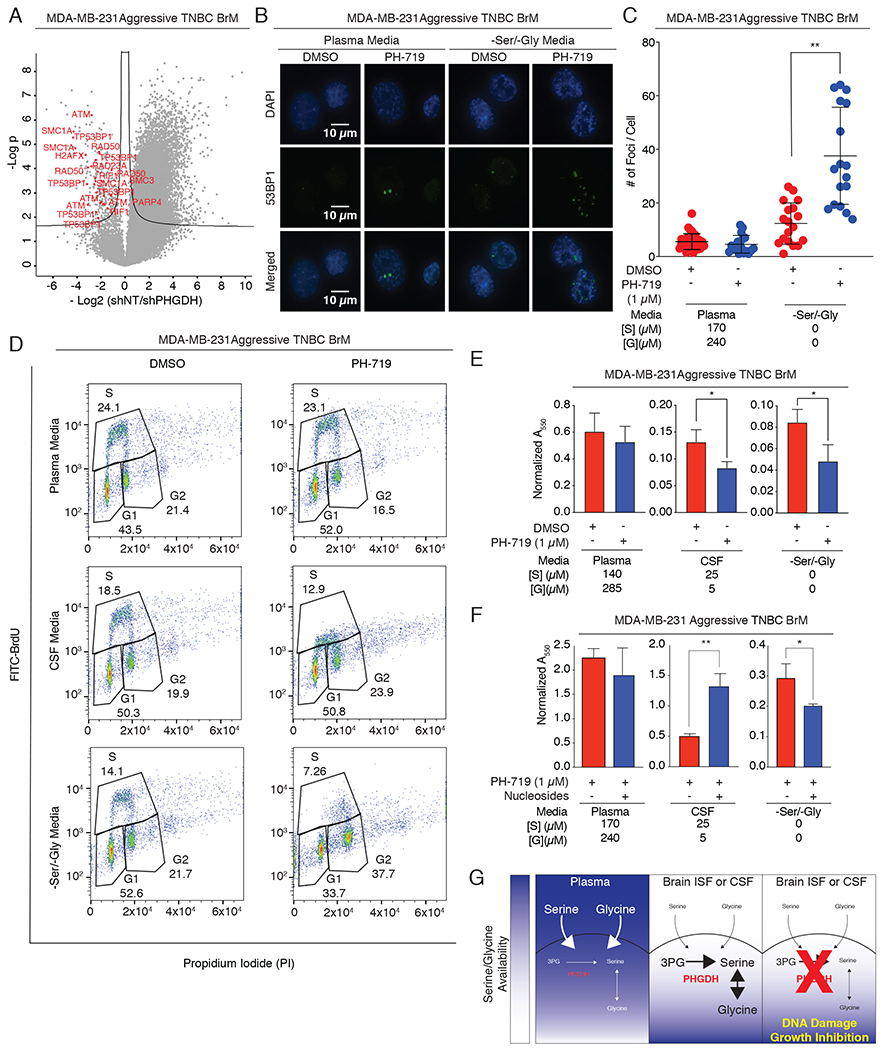
(A) Volcano plot of the p value vs. the log2 phospho-protein abundance differences between aggressive BrM cells expressing a control shRNA or PHGDH shRNA cultured in –Ser/-Gly media (line: FDR < 0.05). Each dot represents a phosphorylation site.
(B) Immunofluorescence staining for 53BP1 foci in aggressive TNBC BrM cells treated with DMSO or the PHGDH inhibitor PH-719 in plasma or -Ser/-Gly media.
(C) Quantitation of 53BP1 foci per cell in (B).
(D) Cell cycle distribution of aggressive TNBC BrM cells cultured in plasma, CSF, or -Ser/-Gly media, and treated with DMSO or PH-719 for 12-16hrs. Cells were labeled with FITC-BrdU for 1 hr and stained with Propidium Iodide (PI).
(E) Quantitation of colony formation assay of aggressive TNBC BrM cells in the absence or presence of PH-719 cultured in plasma, CSF, or –Ser/-Gly media.
(F) Quantitation of nucleoside rescue of in the presence of absence of PH-719.
(G) Working model of brain metastasis sensitization to PHGDH inhibition. In the extracranial microenvironment, abundant exogenous serine and glycine compensate for inhibition of endogenous glucose-derived serine synthesis. The serine- and glycine-limited microenvironment of the brain imposes a metabolic dependency on serine and glycine synthesis, resulting in DNA damage and attenuation of brain metastasis progression when PHGDH is inhibited in brain metastases.