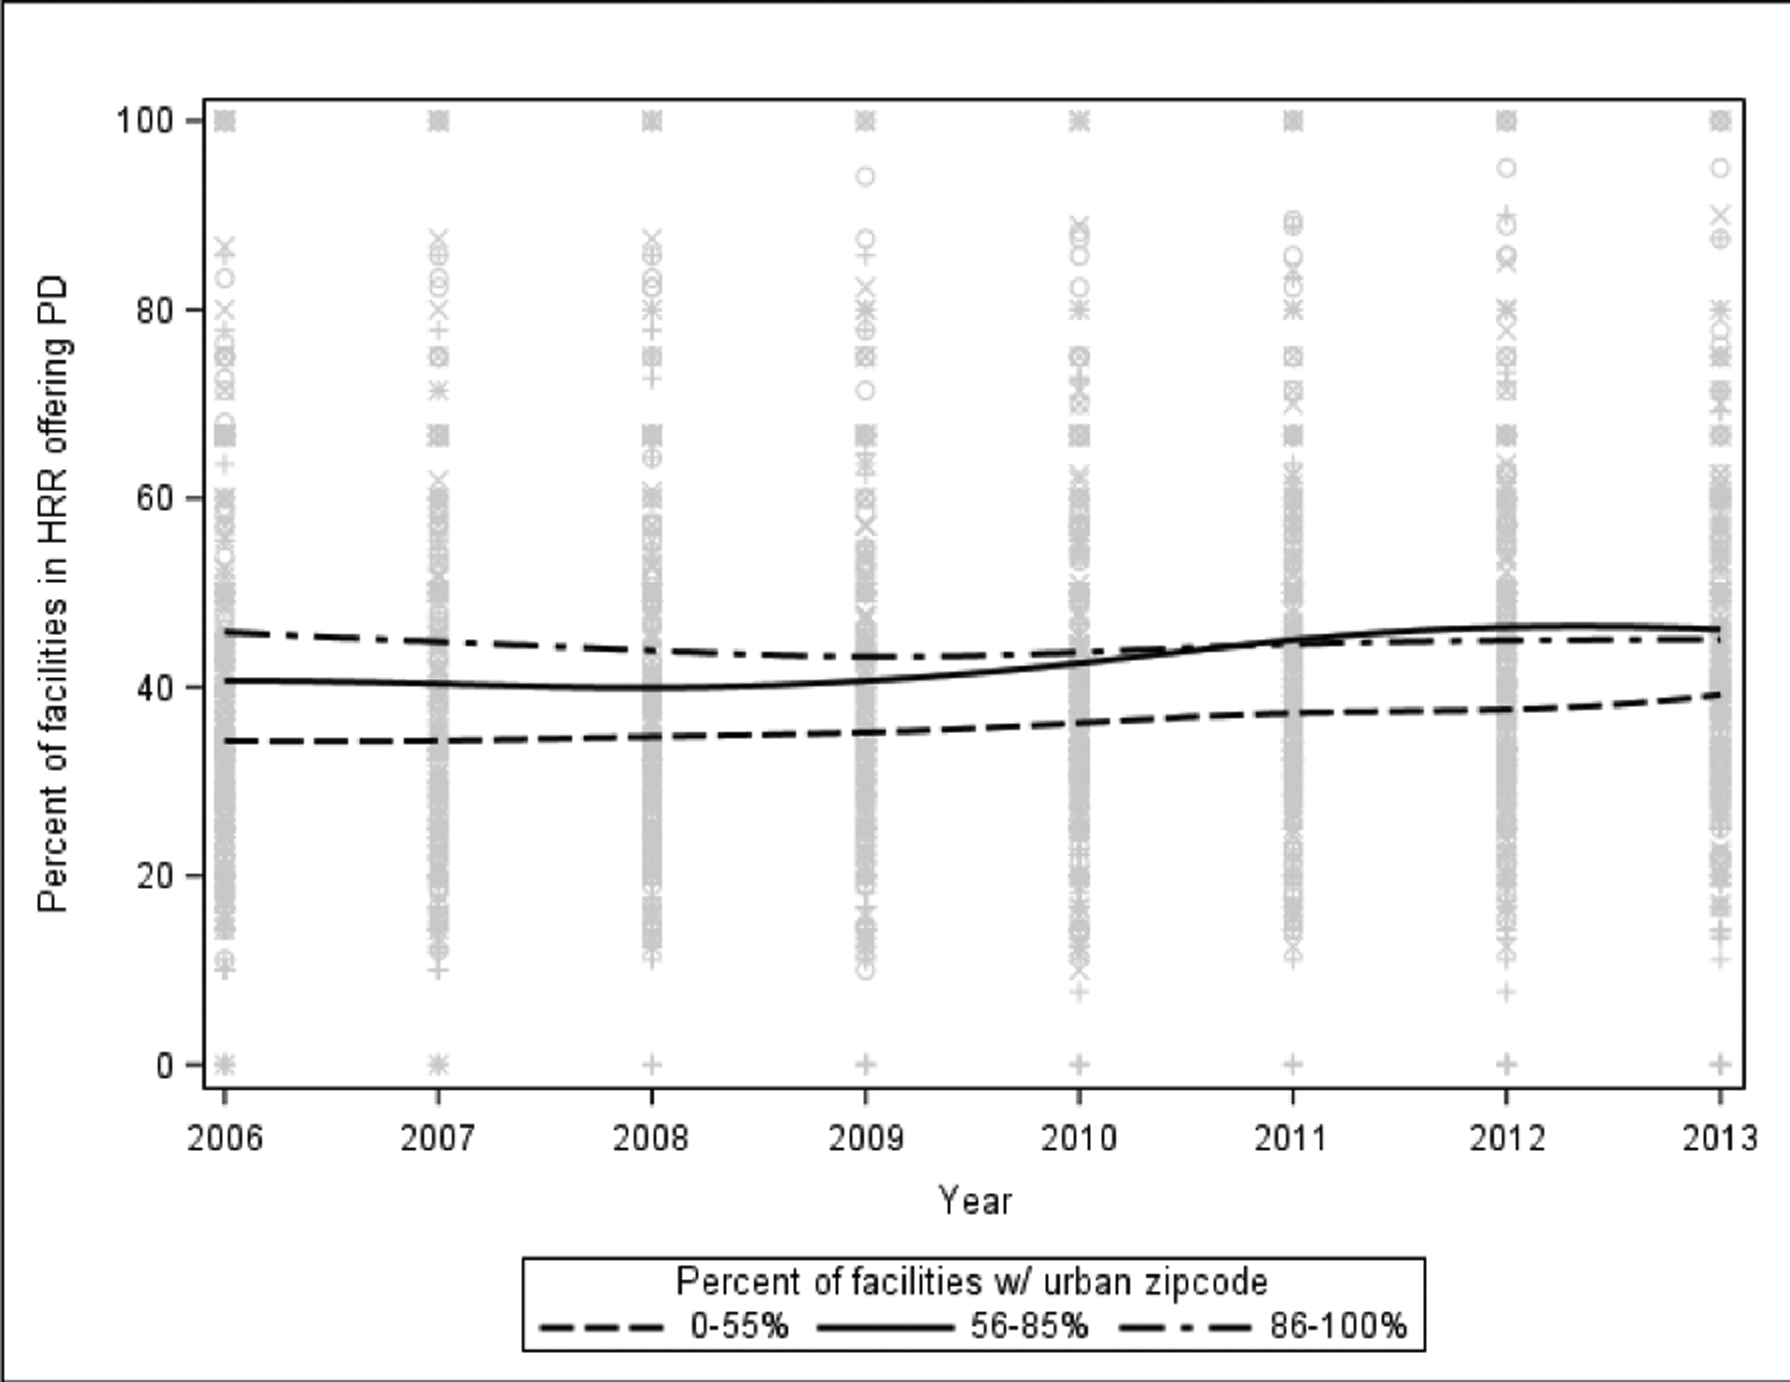
Figure 2. The percentage of facilities offering PD in predominantly rural regions increased, but did not catch up to levels in predominantly urban regions.

This figure represents the penalized B-spline trajectories of regional PD supply, stratified by urban zip code category. Each category contains roughly the same number of HRRs: 103–108 HRRs had 0–55% urban zip codes, 97–103 HRRs had 56–85% urban zip codes, and 99–105 HRRs had 86–100% urban zip codes. The number of HRRs in each group varied slightly by year, as some zip codes that were initially rural came to be defined as urban, and vice versa.
