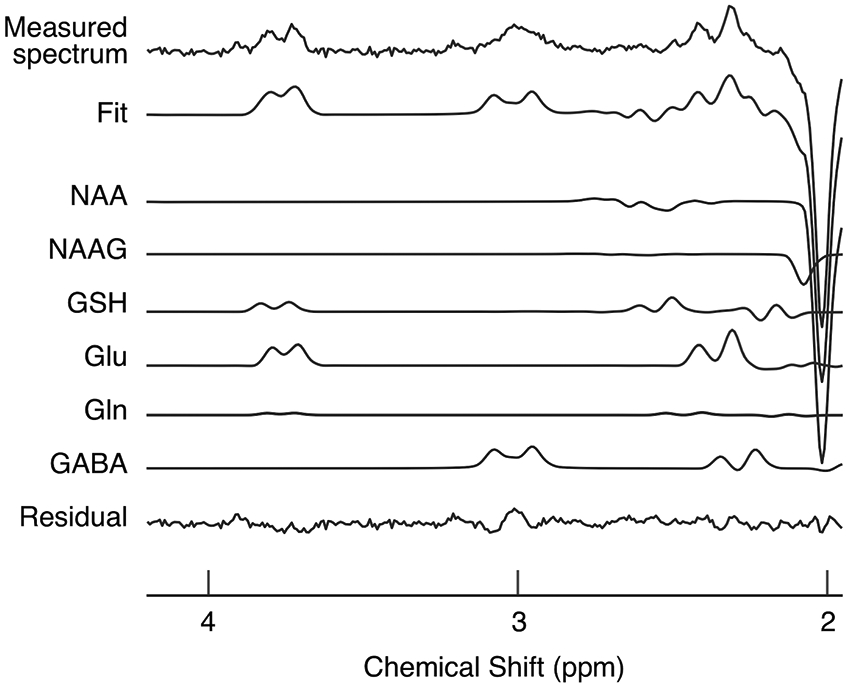
Extended Data Fig. 2. Example spectra from the voxel located in early visual areas.

The measured spectrum is shown in the top row. “Fit” in the second row represents the spectrum fitted with the LCModel (see MRS acquisition in Methods for details). “Residual” in the bottom row represents the residual remaining after the fitting. The remaining rows indicate individual fits for all metabolites that can be detected by a given acquisition. Macromolecular and lipid signals were used for the baseline correction. NAA, NAAG, GSH, Glu, Gln, and GABA represent N-acetylaspartate, N-acetylaspartylglutamate, glutathione, glutamate, glutamine, and gamma-aminobutyric acid, respectively. Glx is obtained by adding glutamine and glutamate in the LCModel. The same procedure was repeated 272 times independently with similar results.
