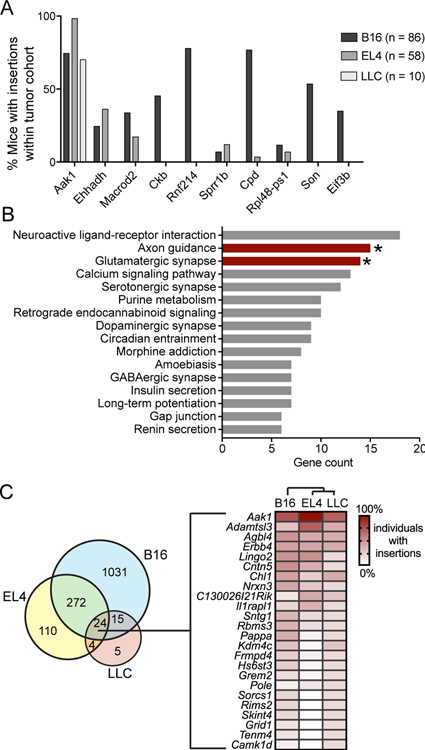
Figure 2. Gene candidate identification in tumor-infiltrating T cells obtained from untreated mice.
A, Percentage of tumor-bearing mice with insertions in the indicated gene across the three models (number of mice in each indicated). Top 10 gene candidates (all tumor models) were ranked by significance, then number of mice, and finally by enrichment score in three tumor models. B, DAVID pathway enrichment analysis was performed on the candidate genes with gCIS FDR<0.001 (544 genes). All functional pathways are listed, with the number of genes in candidate gene list in each functional category on the x-axis. Bars with asterisks are significantly enriched biological processes (P<0.002). C, Venn diagram of all gCIS identified in each tumor model. Numbers represent the total number of gCIS identified (no significance cutoff), illustrating the mutational overlap in intratumoral T cells between tumor models. Mutation frequency of the 24 genes shared by all three models is illustrated by the heatmap, with genes ranked in descending order of average mutation frequency. Cluster analysis (indicated above the heatmap) was performed by the R heatmap function and included mutation frequency for all genes.

