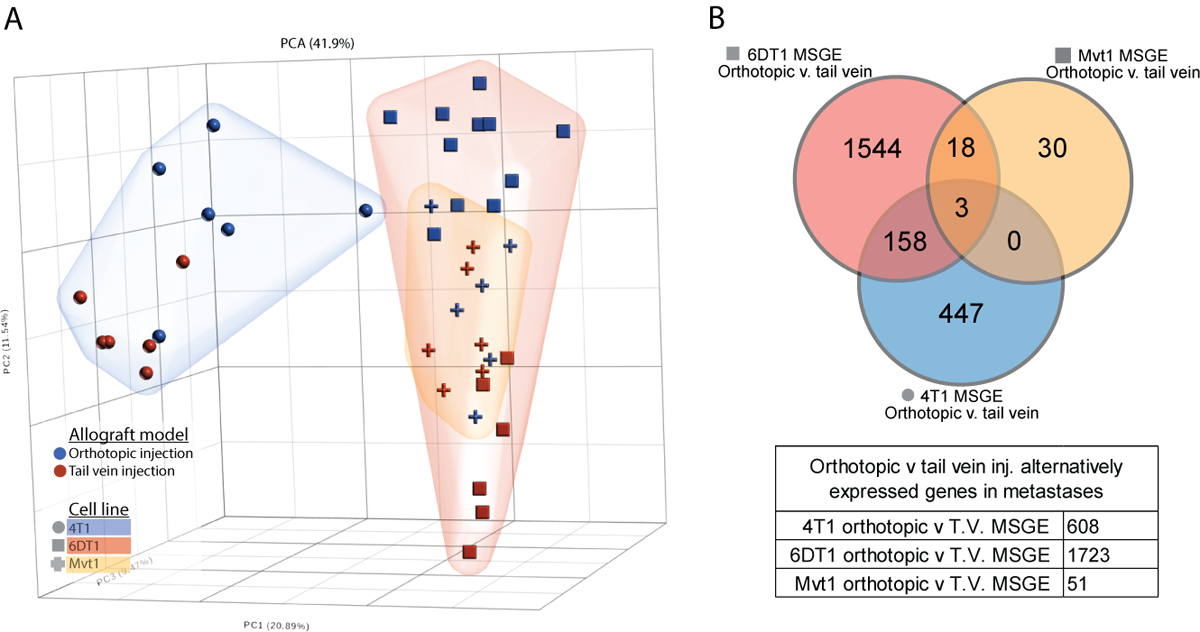
Figure 3. Metastases derived from orthotopic and tail vein injection models differ in a cell line-dependent manner.

(A) PCA analysis plot showing relative difference between the transcriptomes of tail vein-derived lung metastases (red points) and orthotopic injection model-derived lung metastasis (blue points), with 4T1 cells (blue cloud, circles), 6DT1 cells (red cloud, squares), and Mvt1 cells (yellow cloud, crosses). (B) Venn diagram showing the overlapping orthotopic-specific MSGE from the 4T1 (blue), 6DT1 (red), and Mvt1 (yellow) allograft models.
