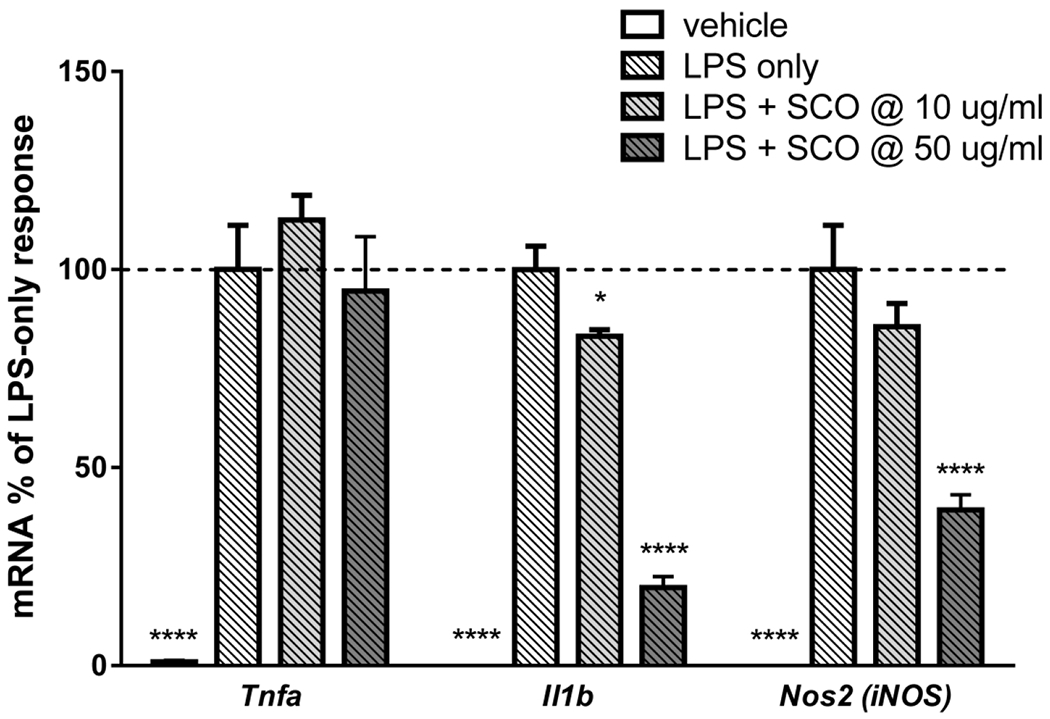
Figure 7. SCO reduces LPS-induced expression of Il1b and Nos2 (iNOS), but not Tnfa in RAW 264.7 macrophages.

RAW macrophages were pretreated with 10 or 50 μg/ml SCO for 2 hours, then with 1 μg/ml LPS for 5.5 hours. RNA was isolated and reverse transcribed. Gene expression was assayed by qPCR, using Nono as the reference gene, and fold-change was calculated versus the average of the LPS-only condition for each gene. Data are shown as means +/− SE; n=4 biological replicates per condition. Data for each gene were analyzed by one-way ANOVA. Significance expressed as *P<0.05, ****P<0.0001 vs. LPS-only controls. Results were replicated in three independent experiments.
