Fig. 1.

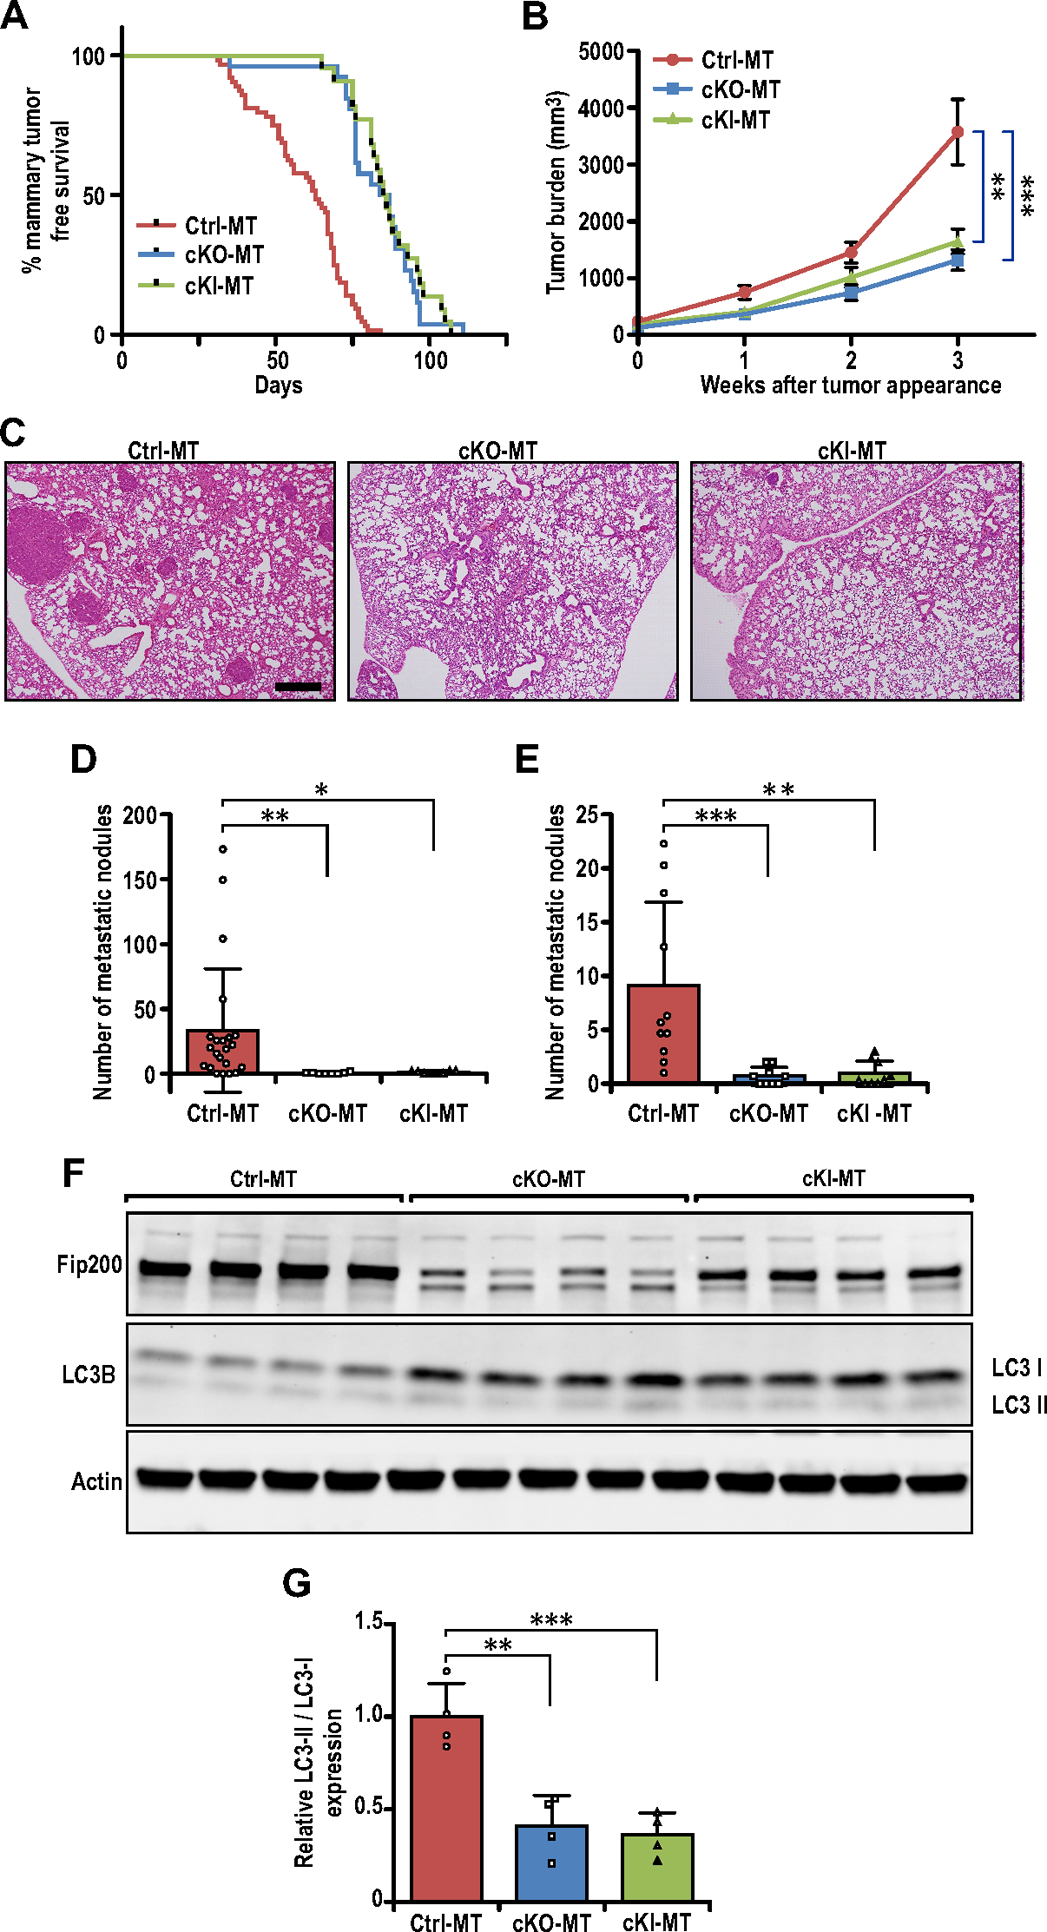
Specific targeting of FIP200’s autophagy function inhibits breast cancer development and metastasis. (A) Tumor free survival curves of Ctrl-MT (n=64 mice), cKO-MT (n=22 mice) and cKI-MT (n=26 mice) cohorts. (B) Tumor growth curves of Ctrl-MT (n=30), cKO-MT (n=12) and cKI-MT (n=14) mice. (C) Representative images for lung sections from Ctrl-MT, cKO-MT and cKI-MT mice. Scale bar represents 500μm. (D) Bar chart showing quantification for number of metastatic nodules per field of view (Ctrl-MT; n=22 mice, cKO-MT; n= 8 mice, cKI-MT n=8), when compared at the same final timepoint. Kruskal-Wallis test followed by Dunn’s post-hoc test was used. (E) Bar chart showing quantification for number of metastatic nodules per field of view (Ctrl-MT; n=11mice, cKO-MT; n=9 mice, cKI-MT; n=9 mice), when lung sections from mice bearing similar tumor loads were compared. Kruskal-Wallis test followed by Dunn’s post-hoc test was used. (F) Immuno-blots showing levels of FIP200, LC3B and β-Actin in Ctrl-MT, cKO-MT and cKI-MT tumors (n=4 for each sample). (G) Bar charts showing quantification of relative LC3-II/LC3-I expression levels. Statistical significance was determined by ANOVA with Tukey’s post-hoc test. * denotes p≤0.05, ** denotes p≤0.01 and *** denotes p≤0.001.
