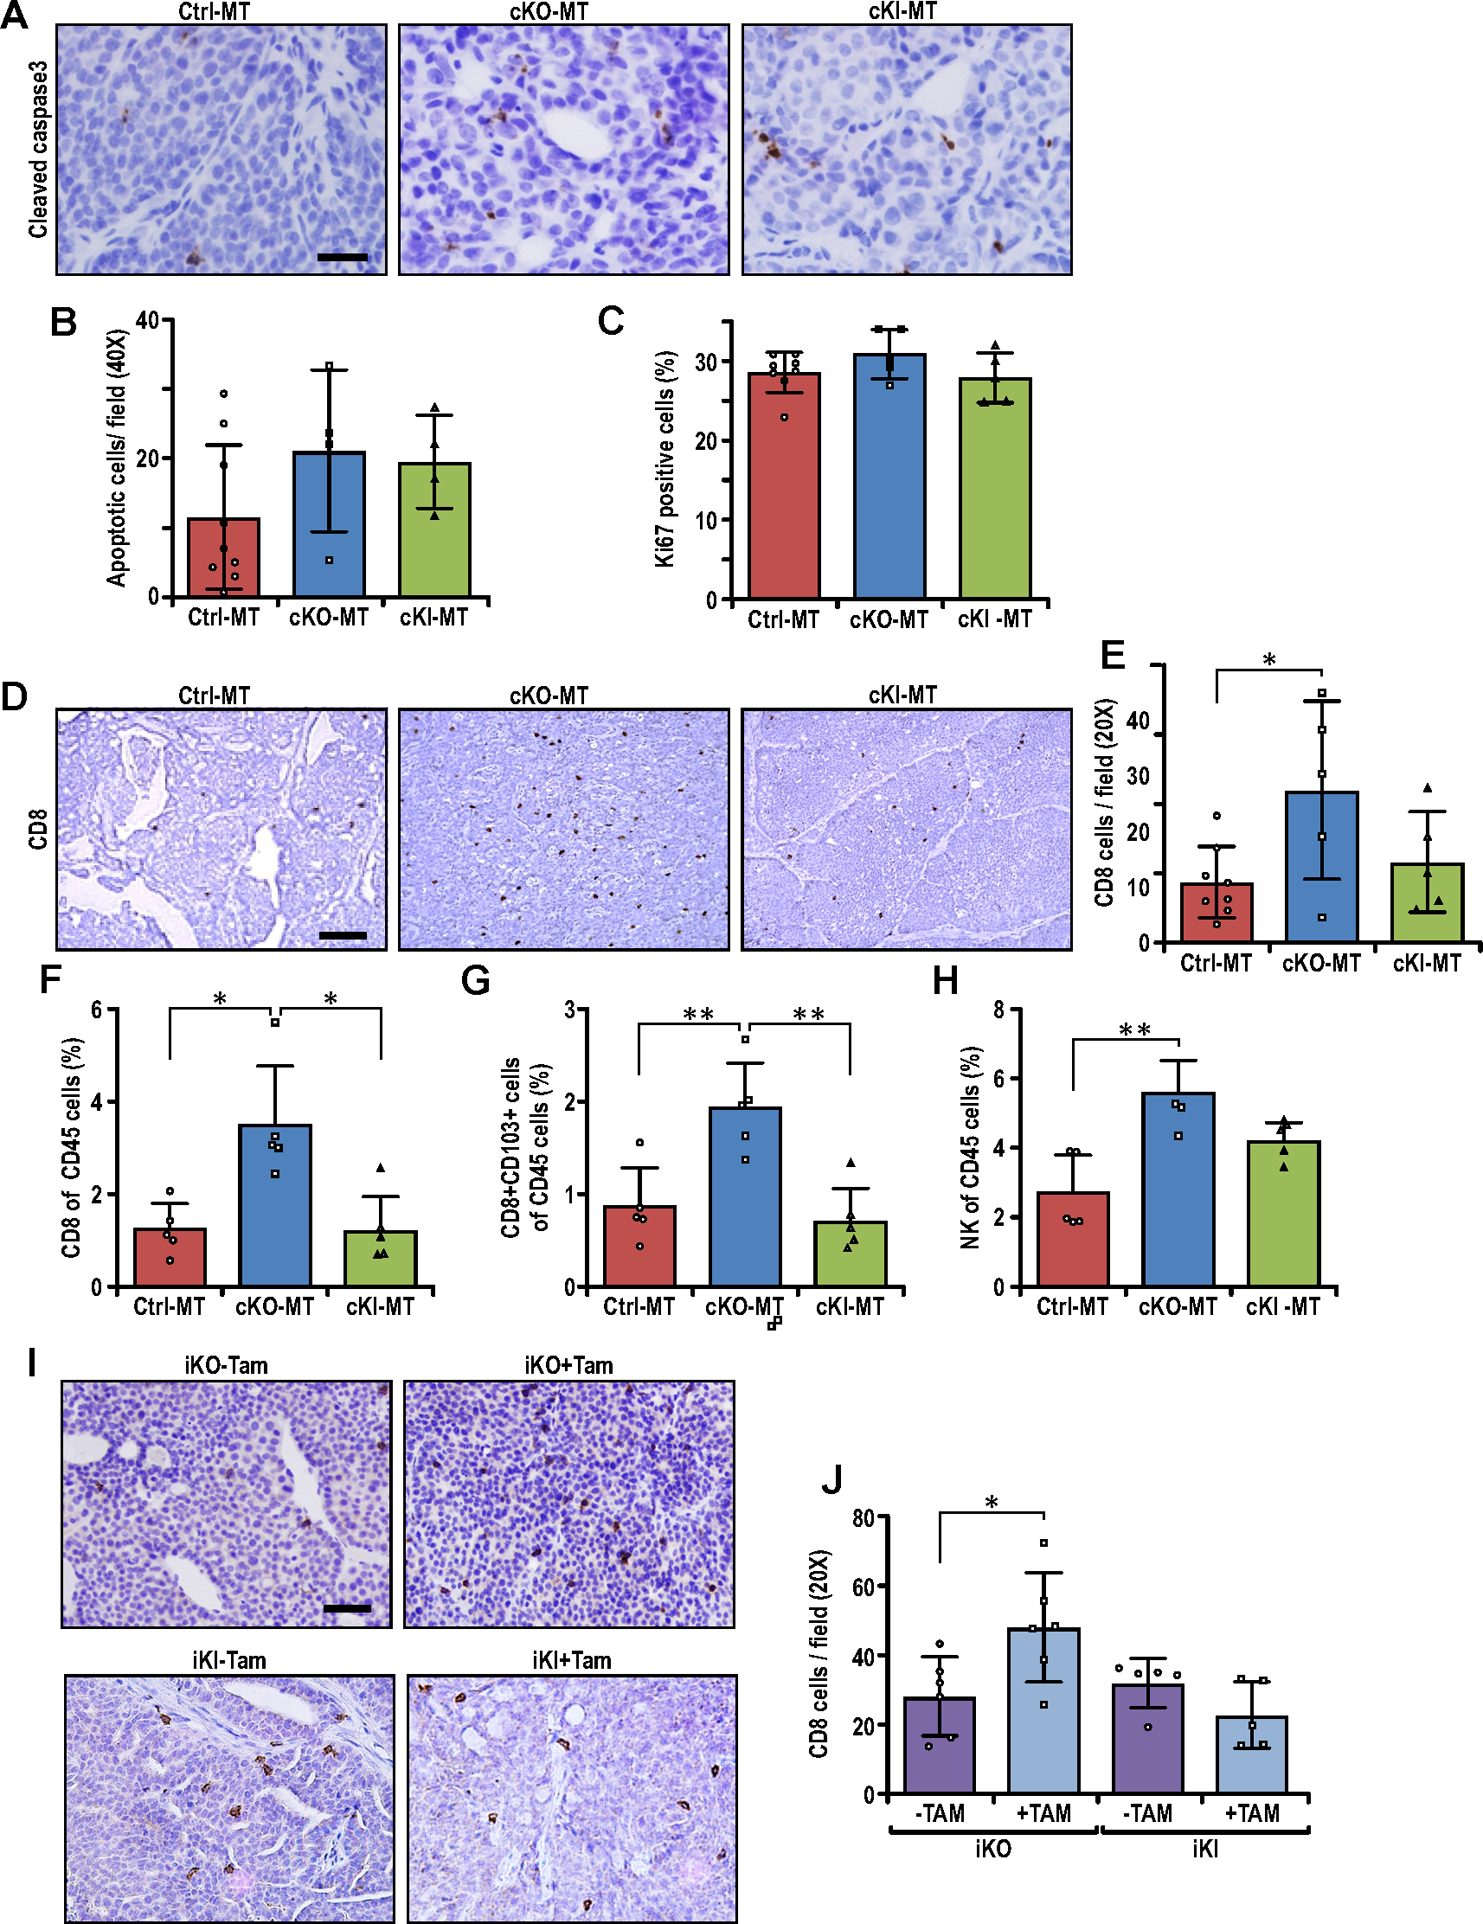
Fig. 2.

Non-canonical autophagy function of FIP200 is responsible for suppressing CD8+ T-cell infiltration in breast cancer. (A) Representative images of Ctrl-MT, cKO-MT and cKI-MT tumors immuno-stained for cleaved-caspase-3. Scale bar represents 50μm. (B–C) Bar charts showing quantification of (B) number of cleaved-caspase-3 positive cells per field of view (Ctrl-MT; n=9, cKO-MT; n=4, cKI-MT; n=4 mice) and (C) number of Ki67 positive cells per field of view (Ctrl-MT; n=8, cKO-MT; n=5, cKI-MT; n=5 mice). ANOVA with Tukey’s post-hoc test was used for figure 2B whereas Kruskal-Wallis test followed by Dunn’s post-hoc test was used for figure 2C. (D) Representative images of Ctrl-MT, cKO-MT and cKI-MT tumors immuno-stained for CD8. Scale bar represents 100μm. (E) Bar chart showing quantification of CD8 positive cells per field of view (Ctrl-MT; n=11, cKO-MT; n=5, cKI-MT; n=5 mice). ANOVA with Tukey’s post-hoc test was used. (F–H) Flow cytometry analysis of (F) CD8+ T cells, (G) CD8+ CD103+ T cells and (H) CD49B+ NK cells as a percentage of CD45+ cells in Ctrl-MT (n=5), cKO-MT (n=5) and cKI-MT (n=5) tumors. Kruskal-Wallis test followed by Dunn’s post-hoc test was used for figures 2F and 2H whereas ANOVA with Tukey’s post-hoc test was used for figure 2G. (I) Representative images of iKO (−Tam), iKO (+Tam), iKI (−Tam) and iKI (+Tam) tumors immuno-stained for CD8. Scale bar represents 50μm. (J) Bar chart showing quantification of CD8 positive cells per field of view in iKO and iKI tumors (iKO-Tam; n=6, iKO+Tam; n=6, iKI-Tam; n=5, iKI+Tam; n=5 mice). Statistical significance was determined by unpaired t-test with Welch’s correction. * denotes p≤0.05, ** denotes p≤0.01 and *** denotes p≤0.001.
