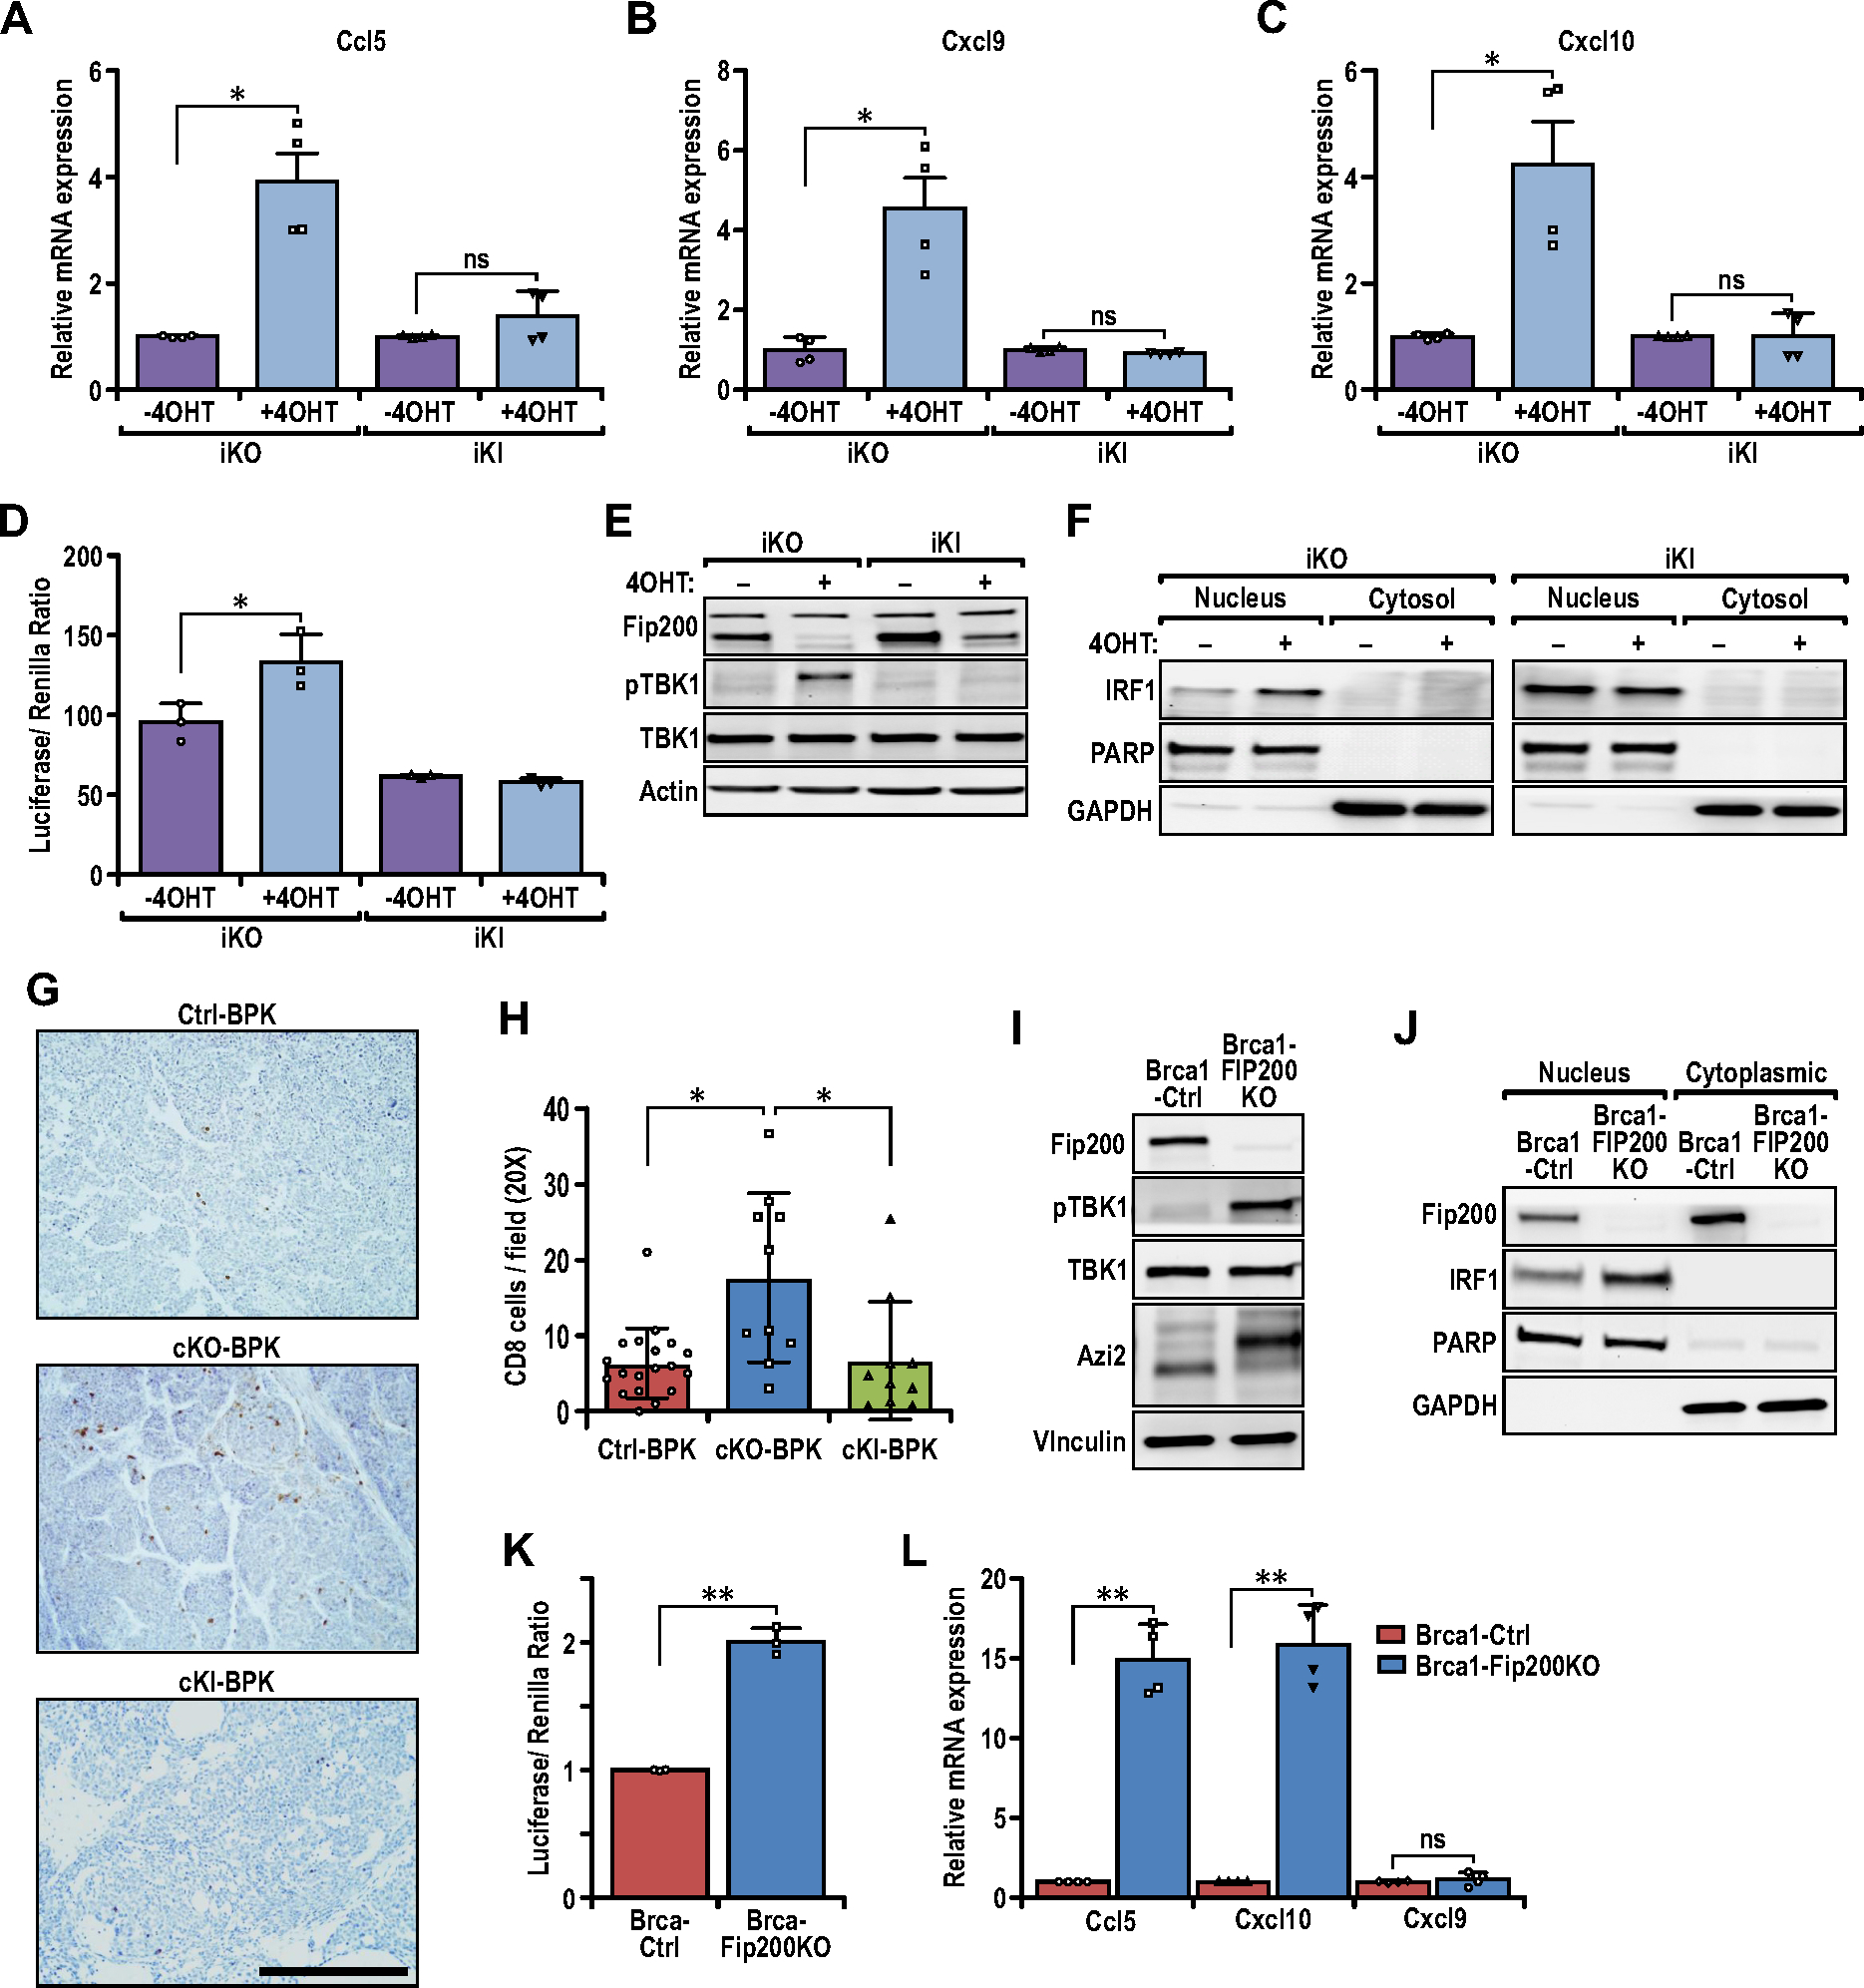
Fig. 3.

Loss of FIP200’s non-autophagy function activates the TBK1-IRF-IFN signaling axis for pro-inflammatory chemokine expression. (A–C) Bar charts showing the relative transcript levels of (A) Ccl5, (B) Cxcl9, and (C) Cxcl10 in iKO (−4OHT), iKO (+4OHT), iKI (−4OHT) and iKI (+4OHT) tumor cells, quantified via qRT-PCR (n=4 for each sample). Statistical significance was determined by unpaired t-test with Welch’s correction. (D) Bar charts showing the luciferase/Renilla luminescence ratio for iKO and iKI cells transfected with the ISG56-reporter plasmid (n=3 for each sample). Statistical significance was determined by unpaired t-test with Welch’s correction. (E) Immunoblots showing the levels of FIP200, p-TBK1, TBK1 and Actin in iKO (−4OHT), iKO (+4OHT), iKI (−4OHT) and iKI (+4OHT) tumor cells. (F) Immunoblots showing the levels of IRF1, PARP and GAPDH in nuclear and cytoplasmic extracts of iKO and iKI cells. (G) Representative images of Ctrl-BPK, cKO-BPK and cKI-BPK tumors immuno-stained for CD8. Scale bar represents 200μm. (H) Bar chart showing quantification of CD8 positive cells per field of view (Ctrl-BPK; n=19, cKO-BPK; n=10, cKI-BPK; n=10 mice). Kruskal-Wallis test followed by Dunn’s post-hoc test was used. (I) Immunoblots showing the levels of FIP200, p-TBK1, TBK1, AZI2 and Vinculin in BRCA1-Ctrl and BRCA1-FIP200KO tumor cells. (J) Immunoblots showing the levels of FIP200, IRF1, PARP and GAPDH in nuclear and cytoplasmic extracts of BRCA1-Ctrl and BRCA1-FIP200KO tumor cells. (K) Bar charts showing the luciferase/Renilla luminescence ratio for BRCA1-Ctrl and BRCA1-FIP200KO cells transfected with the ISG56-reporter plasmid (n= 3 for each sample). Statistical significance was determined by unpaired t-test with Welch’s correction. (L) Bar charts showing the relative transcript levels of Ccl5, Cxcl9 and Cxcl10 in BRCA1-Ctrl and BRCA1-FIP200KO tumor cells, quantified via qRT-PCR (n=4 for each sample). Statistical significance was determined by unpaired t-test with Welch’s correction.
