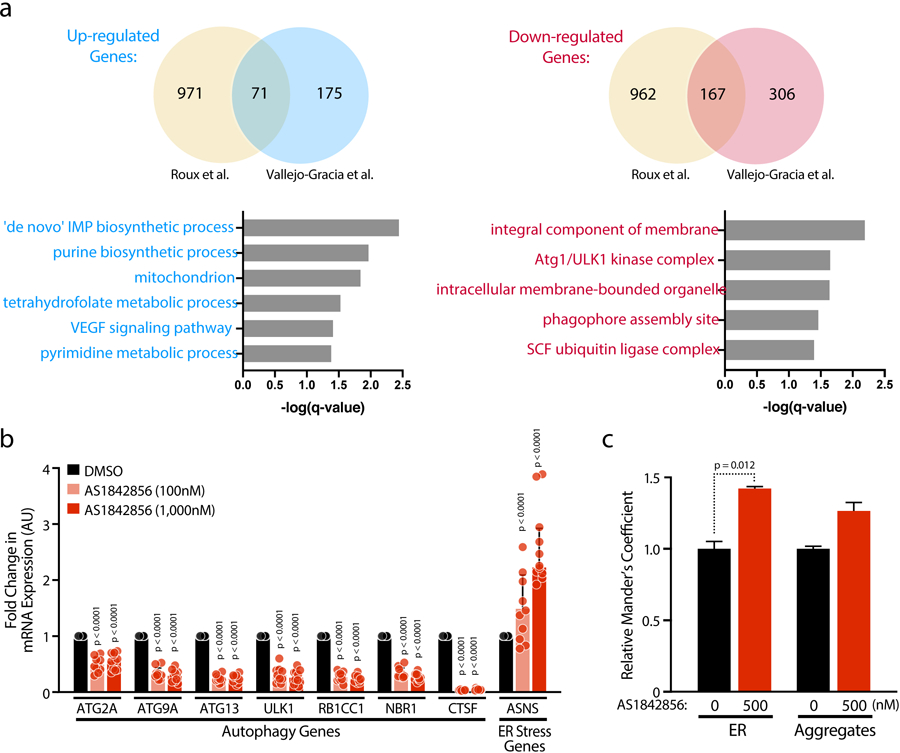
Extended Data Fig 4.

a, Venn diagrams (top panels) comparing the up- and down-regulated genes from a recently published Affimmetrix microarray[19] and RNA-Seq data presented here (Vallejo-Gracia et al.). GO Enrichment Analysis (Biological Processes and Cellular Components) from overlapped dysregulated genes from the two datasets. b, Confirmation of selected up- or down-regulated genes and pathways after 72 h AS1842856 treatment in CD4 T cells of HIV-infected patients on antiretroviral therapy with undetectable viral load by RT-qPCR, normalized to RPL13A mRNA. Data represent mean ± SD of n = 10 individual donors. c, The thresholded Mander’s correlation coefficients were determined and P value was calculated by unpaired Student’s t test. n = 90 cells per condition. Data are represented as mean ± SD.
