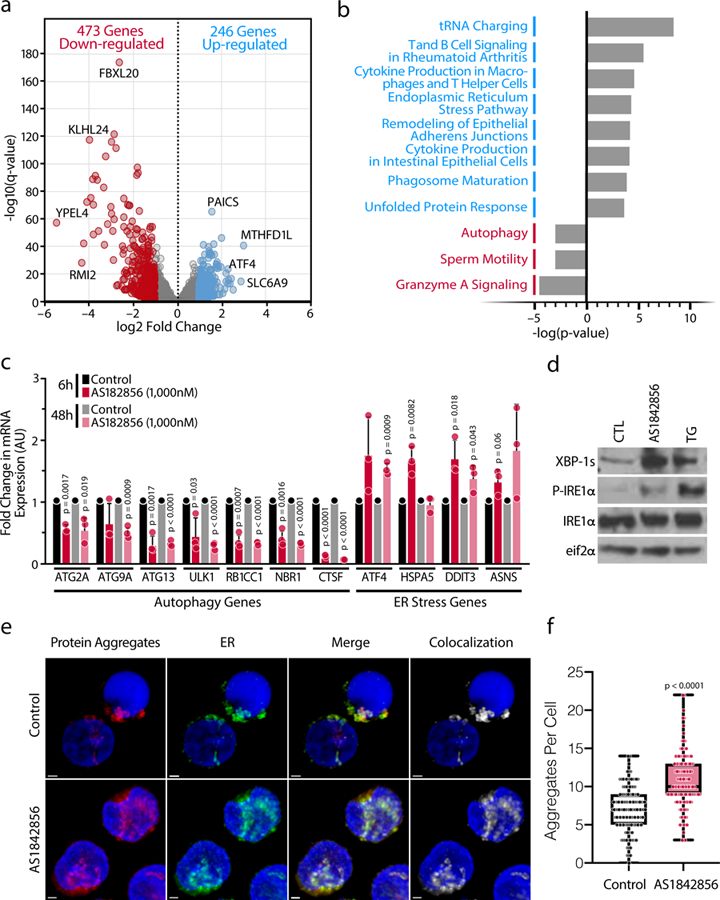
Figure 4. Marked Upregulation of ER Stress in Response to FOXO1 Inhibition in Primary CD4+ T cells.

a, Volcano plot from the RNA-Seq data comparing CD4+ T cells treated with AS1842856 (1,000 nM) versus DMSO control for 12 hours. Up-regulated (blue) or down-regulated (red) genes are q-value < 0.05 and log2 fold change ≥ 1 or ≤ −1, respectively. b, IPA pathway analysis of the most dysregulated canonical pathways for the up- and down-regulated genes. c, Confirmation of up- or down-regulated expression after 6 and 48 hours treatment of specific genes from altered pathways by RT-qPCR, normalized to RPL13A mRNA. Data represent mean ± SD of n=3 individual donors. d, Representative blots of protein expression of the ER stress markers XBP-1s, phosphorylated IRE1α and total IRE1α and total eIF2α (control). Representative experiment of n=3 independent experiments. e, Representative confocal microscopy images of primary CD4+ T cells isolated from PBMCs. Cells were treated with AS1842856 (500 nM) for 72 hours and processed for immunostaining after treatment with Proteostat (protein aggregates, red), GRP78 (endoplasmic reticulum, green), and Hoechst (nuclei, blue). The scale bars represent 1μm. Data are representative of n=3 independent experiments. f, The number of protein aggregates per cell. Data are represented as box plots: Control (min: 0, Q1: 5, center: 7, Q3: 9 max: 14), AS1842856 (min: 3, Q1: 9, center: 10, Q3: 13, max: 22). The P value was calculated by a linear mixed model by residual maximum likelihood. p-value < 2-16. n = 135 cells per condition.
