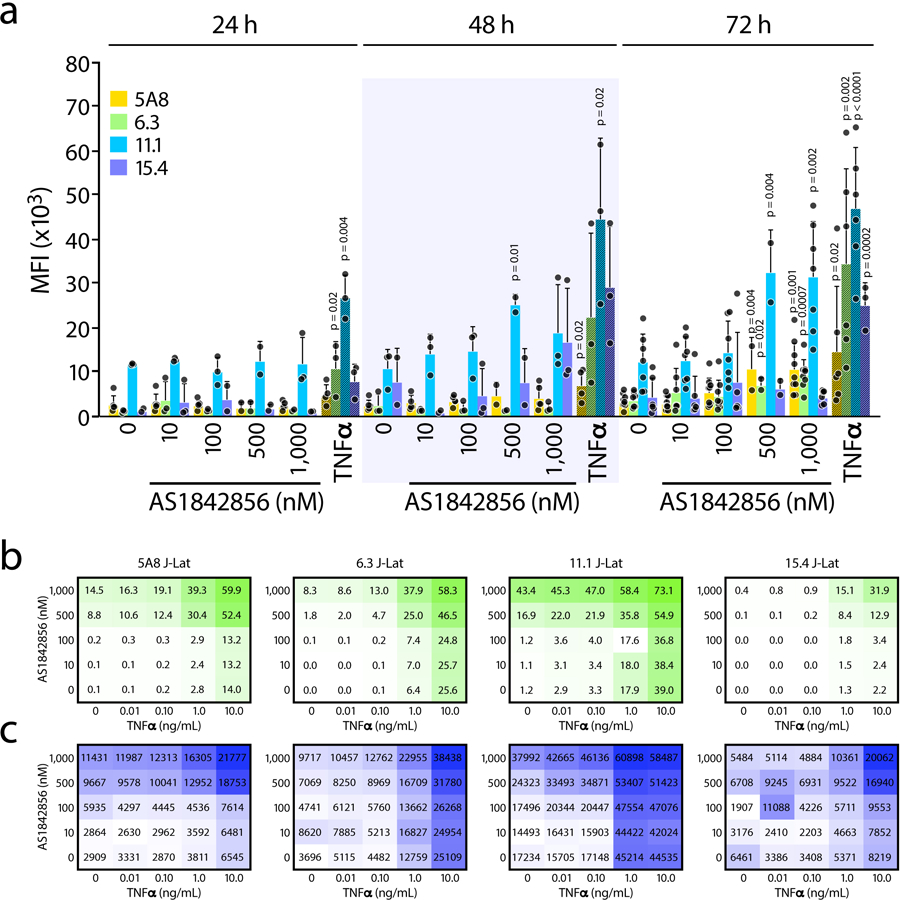
Extended Data Fig 2.

a, J-Lat cell lines 5A8, 6.3, 11.1 and 15.4 were treated with increasing concentrations of AS1842856 for 24, 48 and 72 h and HIV-GFP reactivation was analyzed by flow cytometry. HIV-GFP reactivation is reported as a Mean Intensity Fluorescence (MFI) of GFP-expressing cells. Data represent mean ± SD of n ≥ 3 independent experiments. 10 ng/mL TNFα was used as control. b, J-Lat cell lines 5A8, 6.3, 11.1 and 15.4 were treated for 72 h with increasing concentrations of both AS1842856 (Y-axis) and TNFα (X-axis) alone or in combination and analyzed by FACS. HIV-GFP reactivation is reported as a percentage of GFP-expressing cells (% GFP + cells) or c, Mean Intensity Fluorescence (MFI). Data represent mean of n = 3 independent experiments.
