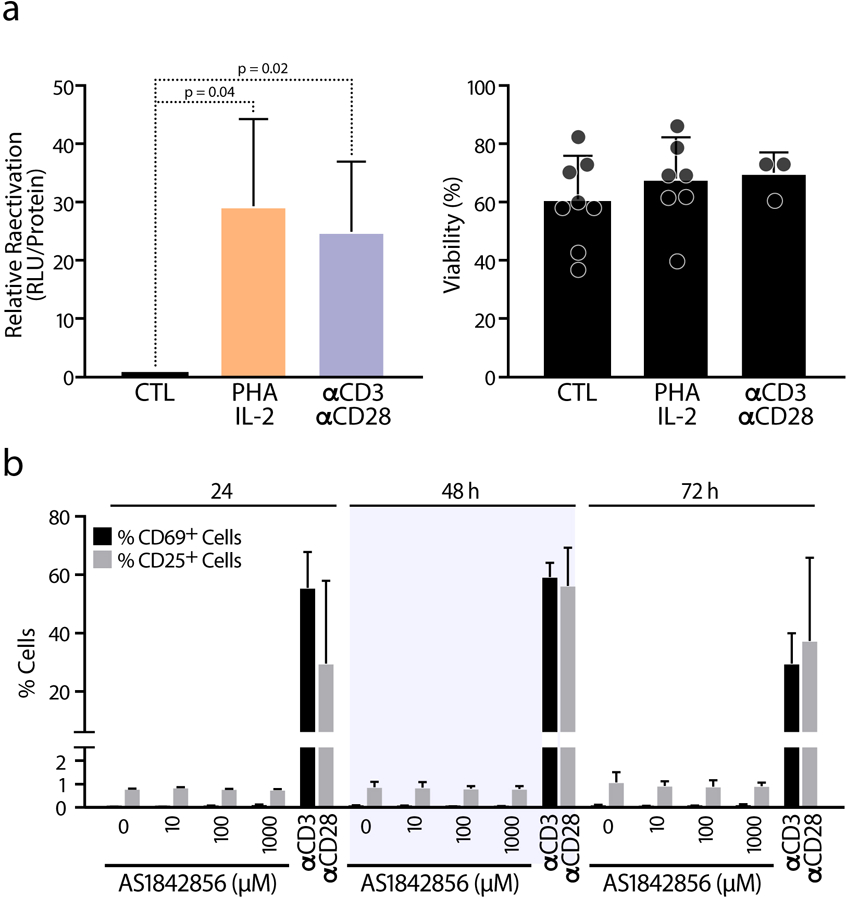
Extended Data Fig 3.

a, HIV reactivation was measured by luciferase activity and cell viability by flow cytometry assessed in CD4 T cells purified from blood of healthy donors and infected with HIV and letting them rest for 6 days before reactivation was induced with 10 μg/mL PHA + 100 U/mL IL-2 and 10 μg/mL αCD3 + 1 μg/mL αCD28 for 72 h, in the presence of raltegravir (30 μM). Data represent average ± SD of n ≥ 3 independent experiments. b, The cell surface CD69 and CD25 T cell activation markers were measured by FACS in CD4 T cells upon AS1842856 treatment for 24, 48 and 72 h. 10 μg/mL αCD3 and 1 μg/mL αCD28 was used as control. Data is shown as mean of percentage of positive cells and as mean ± SD of n = 2 biological replicates.
