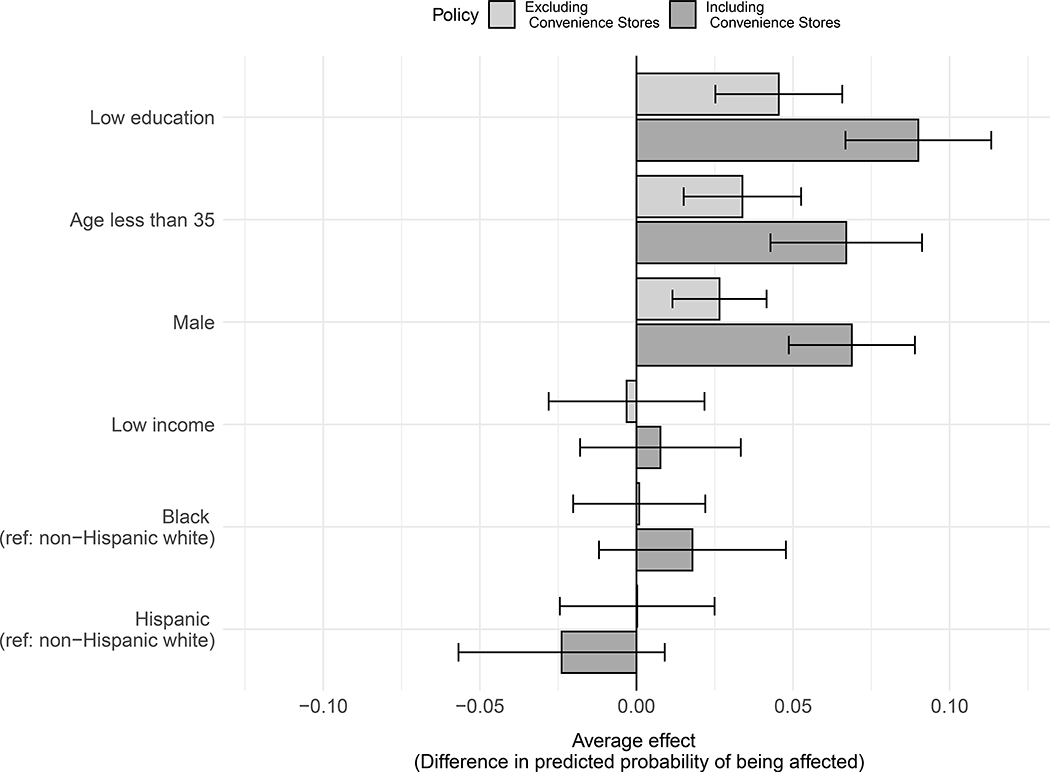
Figure 1:
Associations between demographic groups and predicted probability of being likely affected by a portion size regulation
Notes: Reference groups are college education, age 35–65, female, income greater than 185% of federal poverty line, and non-Hispanic white. Error bars depict 95% confidence interval limits. Intervals that do not cross zero are statistically significant (p<0.05). Average effects and 95% confidence intervals calculated using margins command in Stata 16.1. Average effect is the difference in average predicted probability of being affected by a portion size regulation in the group of interest minus the reference group calculated using the method of recycled predictions. Average effects can be multiplied by 100% to yield approximate effects in percentage points (e.g., an average effect of 0.034 indicates a difference of approximately 3.4 percentage points). Regulated sources include restaurants, fast food or pizza restaurants, bars/taverns, sports/entertainment facilities, street vendors, and convenience stores.

