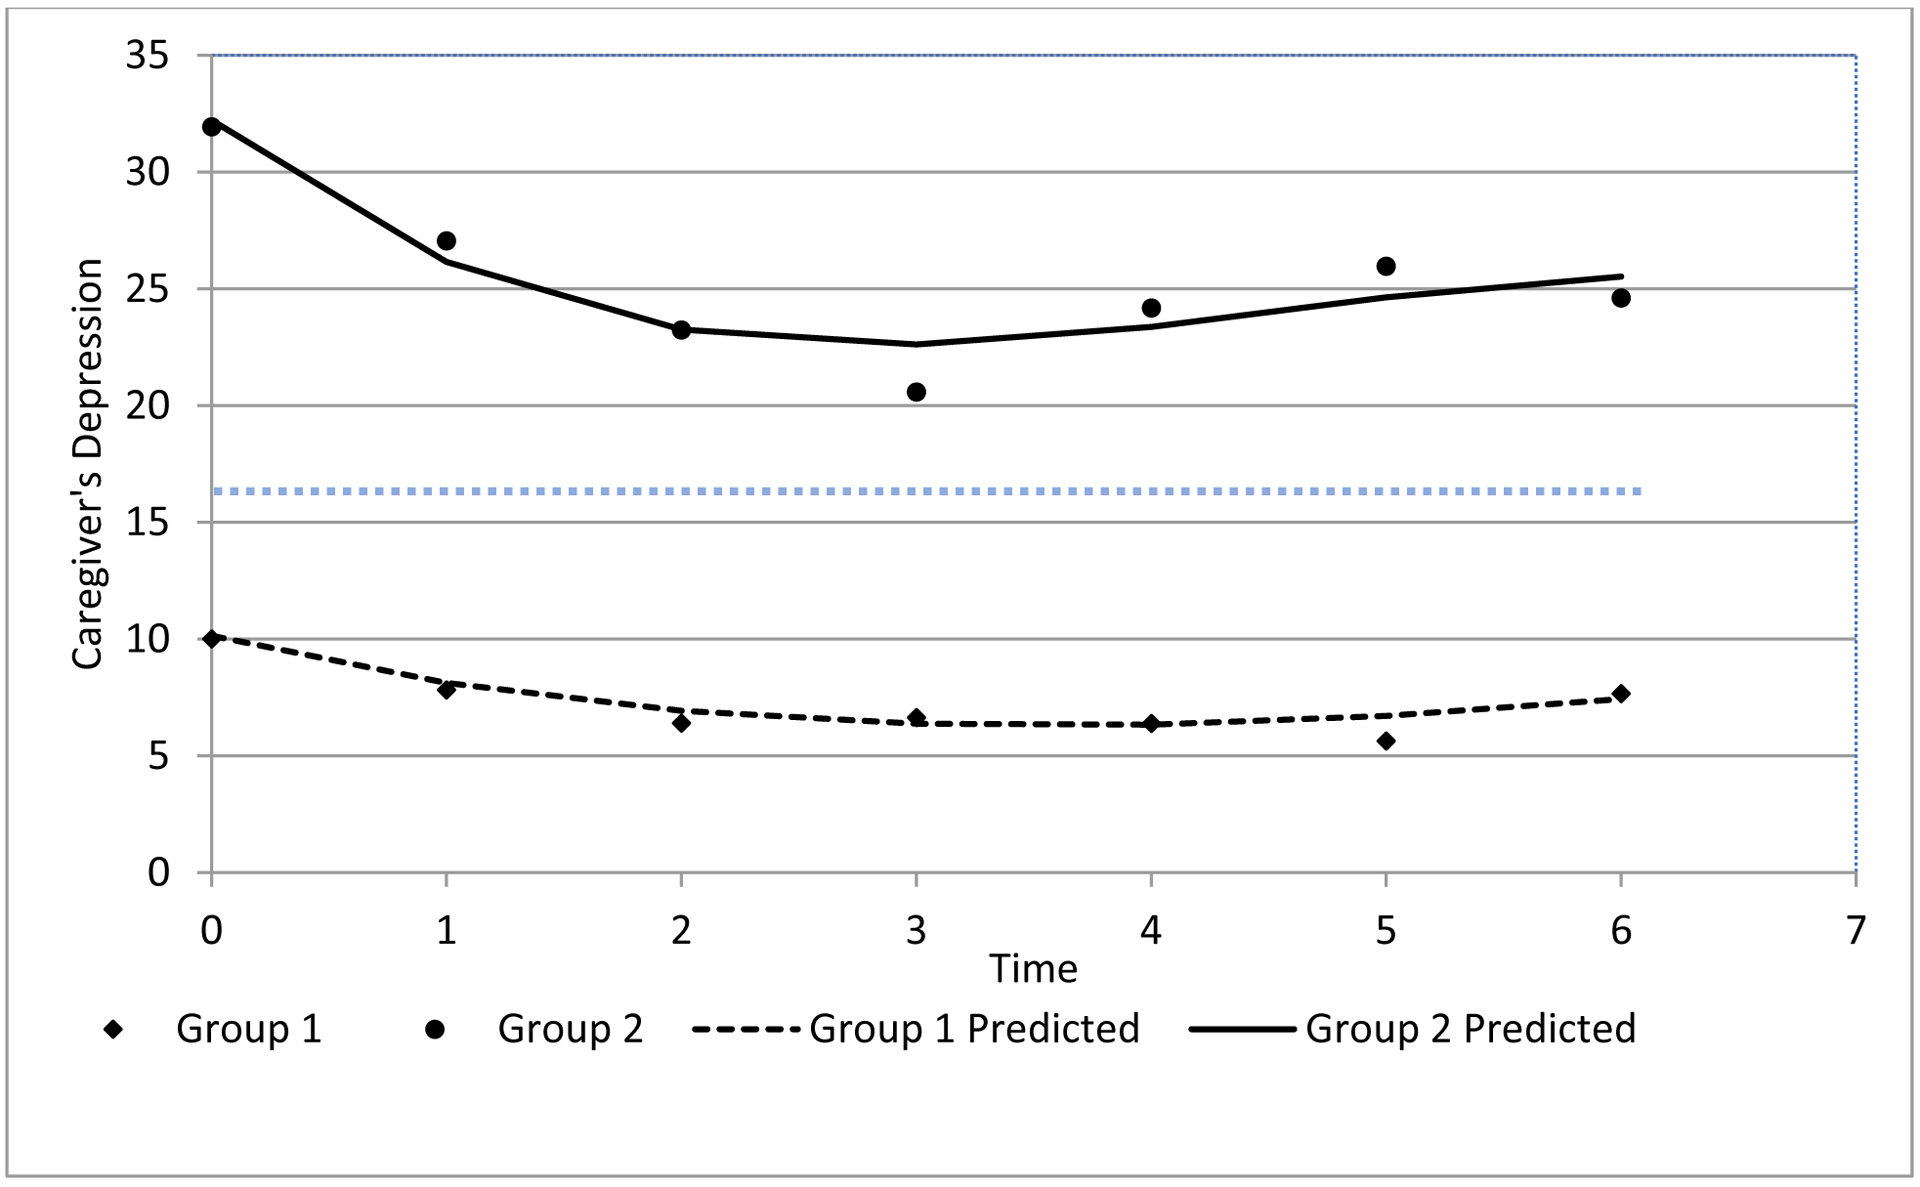
Figure 2:

Semi-parametric trajectory analyses of caregivers’ depressive symptoms, n=179
* Group 1=Depressive symptoms below clinical cutoff; Group 2=Depressive symptoms above the clinical cutoff; the blue dotted line represents the clinical cutoff score “16” of the Center for Epidemiologic Studies-Depression.
* Time Point 0=Diagnosis of Patient; Time Point 1=2 months; Time Point 3=4 months; Time Point 4=6 months; Time Point 5=8 months; Time Point 6=10 months
