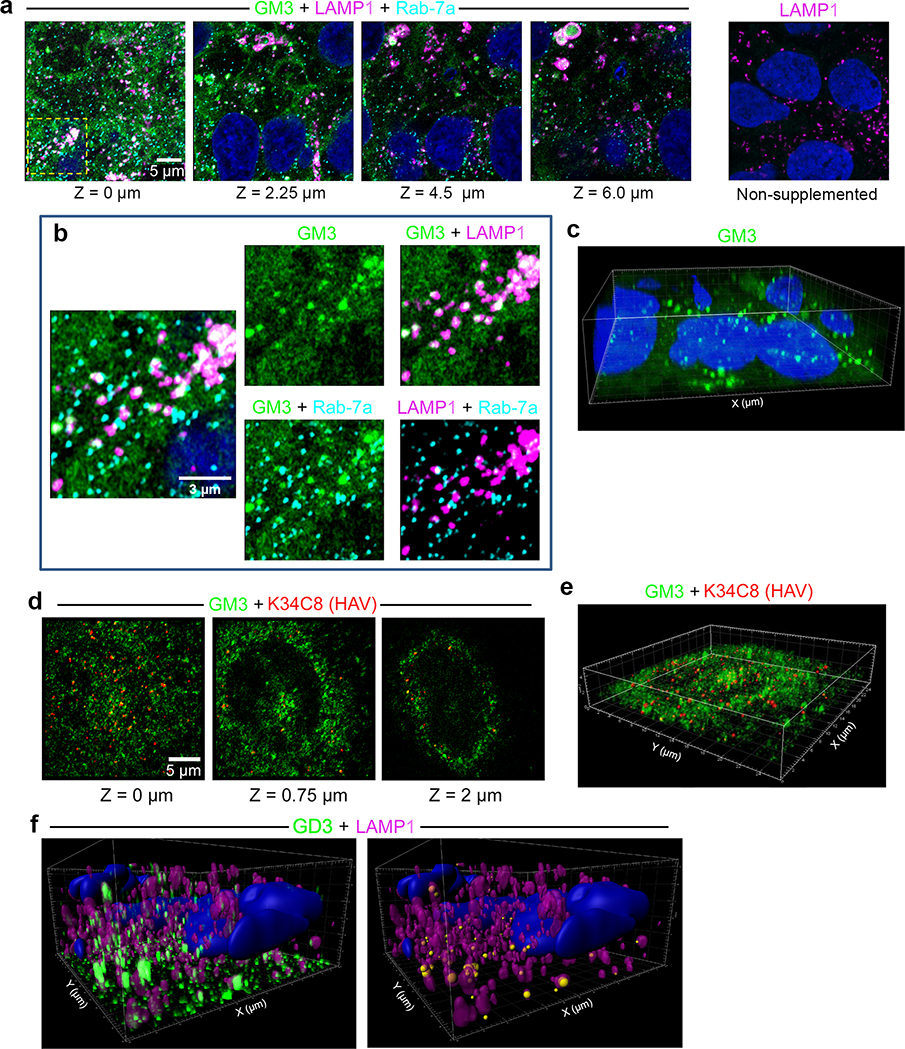
Extended Data Fig. 9.
Intracellular distribution of GM3 following supplementation of UGCG-KO1.3 cells.
a. Cells were incubated with GM3 conjugated at C11 to dipyrrometheneboron difluoride undecanoic acid (GM3-TopFluor, green) for 15 hr at 37 ºC, then fixed and labelled with anti-LAMP1 (magenta) and anti-Rab-7a (red). Airyscan images from left to right show four optical sections along the Z-axis and demonstrate GM3-TopFluor within cells. At the far right, non-supplemented cells stained with anti-LAMP1 show no green fluorescence. b. Enlarged images of the area bounded by the yellow rectangle in panel (a) showing TopFluor within Rab-7a+ late endosomes and LAMP1+ endolysosomes. Some endolysosomes are labelled with antibodies to both LAMP1 and Rab-7a. c. 3D reconstruction of GM3-TopFluor and DAPI (nucleus) fluorescence signals in the images shown in panel (a). d. UGCG-KO1.3 cells were incubated with GM3-TopFluor (green) for 13 hr, then infected with nHAV virus for 2 hr, washed and re-incubated for 4 hrs before being fixed and labelled with anti-HAV antibody (K34C8, red). Optical sections recorded along the Z-axis demonstrate relative positions of HAV and GM3-TopFluor. e. 3D reconstruction of the image shown in panel (d) (see also Supplementary Movie 2). f. (left) Imaris 3D reconstruction of GD3 fluorescence signals in uninfected UGCG-KO1.3 cells supplemented with exogenous GD3 and stained with anti-GD3 antibody. The surface of endolysosomes is reconstructed from the LAMP1 signal. (right) GD3 fluorescent signal is rendered as spheres with diameter proportionate to intensity, centered at the point of maximum intensity, colored according to whether it is inside (orange) or outside (yellow) LAMP1+ endolysosomes. Images shown are representative of two independent experiments with similar results.

