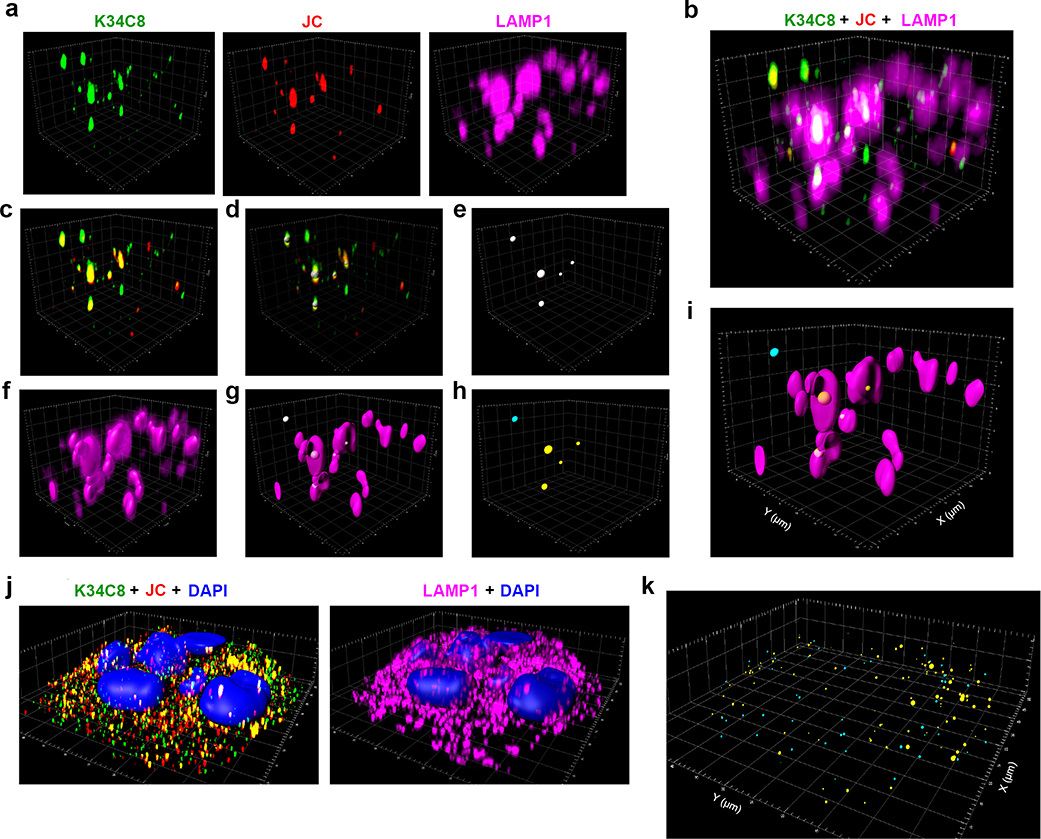
Extended Data Fig. 10.
Imaris analysis and 3D reconstruction of Airyscan microscopy images.
a. A small area within the fluorescence image of infected UGCG-KO1.3 cells recorded on the Zeiss-880 microscope with the Airyscan detector, showing the signals in individual channels for HAV capsid antibodies, K34C8 (green) and JC (red), and antibody to LAMP1 (magenta). b. Merged signals from panel (a). c. Merged signals from the two capsid antibodies, K34C8-Alexa488 and JC-Alexa594. To enhance the specificity of virus detection, only particles labelled simultaneously with both antibodies above threshold were included in the analysis. d. The positions of viral particles identified by labeling with both antibodies were modeled as spheres, with their center positioned at the point of maximum signal intensity, and their diameter proportional to the intensity and size of the fluorescence signal. e. Spherical representation of dually-labelled virus particles as in panel (d). f. Surface of LAMP1+ endolysosomes reconstructed from the LAMP1 antibody signal. g. Merged image of viral particles modeled as spheres and LAMP1+ endolysosomes. h. The Matlab extension in the IMARIS software package was used to analyze the coordinates of the virus particles and to segregate them into two groups: one in which the center was inside or on the surface of endolysosomes (yellow spheres), and another in which the center was outside of endolysosomes (blue spheres). i. Merged image after reconstruction and analysis. j. Full-field fluorescence images of (left) HAV capsids and (right) LAMP1+ endolysosomes with DAPI staining of nuclei in infected UGCG-KO cells. k. Results of the viral particle localization analysis showing segregation of particles into groups by color within the full-field image shown in panel (j). See also Extended Data Movie 1. Airyscan images and 3D reconstructions are representative of three independent experiments showing similar results.

