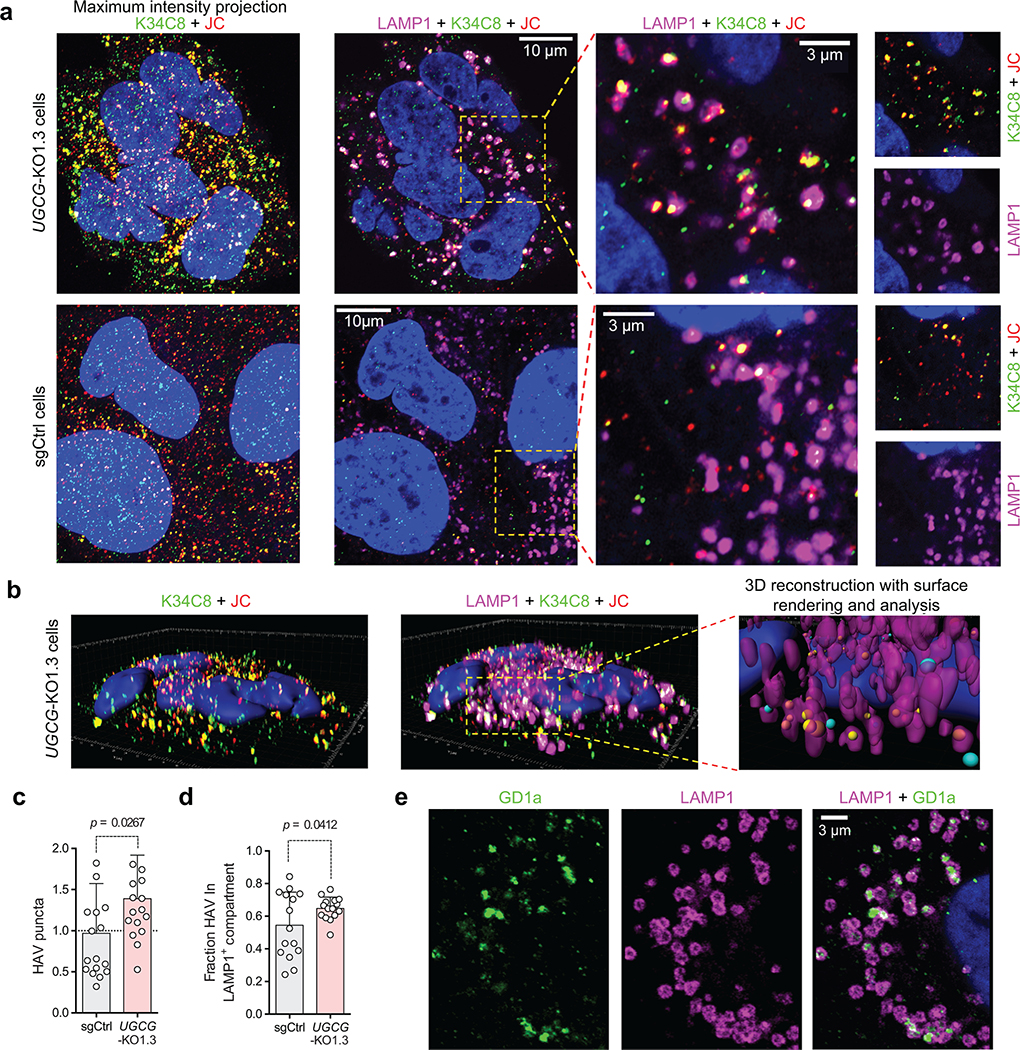
Figure 4.
Airyscan microscopy images of UGCG-KO1.3 and sgCtrl cells infected with gradient-purified 18f nHAV (~100 GE/cell). Virus was adsorbed to cells for 2 hrs at 37ºC, then washed off and the cells re-incubated for 4 hrs until fixed and stained with antibodies to the HAV capsid (K34C8, green, and JC, red) and the endo-lysosomal marker LAMP1 (magenta). a. (left) Maximum intensity projection of recorded Z-stack fluorescence images demonstrate fewer virus-specific puncta dually-labelled with both anti-HAV antibodies (yellow) in sgCtrl cells. (right) Related Airyscan optical sections, enlarged on the right to show the area delineated by the yellow rectangle, with smaller panels showing virus-specific (K34C8 and JC) and endolysosome-specific (LAMP1) signals. Dually-labelled virus particles are present within LAMP1+ endolysosomes. b. 3D reconstructions of virus- and endolysosome-specific signals in UGCG-KO1.3 cells. An example of post-imaging processing is shown in the far-right image with the endolysosome surface rendered from the LAMP1 signal (magenta). Viral particles dually labelled above threshold with both murine K34C8 and human JC anti-HAV antibodies are shown as spheres with diameters and centers corresponding to the magnitude and position of the fluorescent signal. Spheres with centers inside endolysosomes are colored yellow; those outside the endolysosomal surface are colored blue. Scale unit = 1 μm. c. Mean number of virus-specific puncta ±s.d. in UGCG-KO relative to sgCtrl cells. n=17 randomly selected fields from 3 independent experiments; results were normalized to puncta present in sgCtrl cells in each experiment. Statistical testing was by two-tailed Mann-Whitney test. d. Mean proportion of virus-specific puncta ±s.d. within LAMP1+ endolysosomes in UGCG-KO1.3 versus sgCtrl cells. n=15 randomly selected microscopic fields, 5 from each of 3 independent experiments. Statistical testing was by two-tailed, paired t-test. See Extended Data Fig. 10 for additional details concerning the modeling and analysis methods. e. Single Airyscan optical section of Huh-7.5 cells showing endogenous GD1a (green) and LAMP1 (magenta) detected by indirect immunofluorescence. The image is representative of 7 randomly selected fields from one experiment.

