Extended Data Fig. 4.
Mass spectrometry identification of gangliosides present in Huh-7.5 cells.
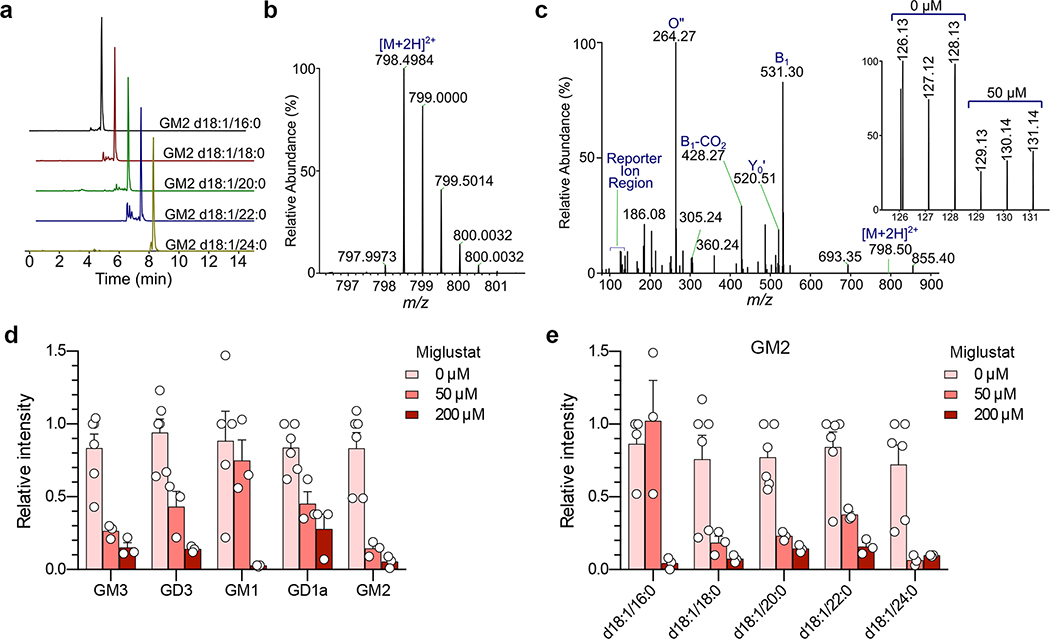
a. Extracted ion chromatograms (EIC) of GM2 ganglioside species showing their elution order.
b. Representative ESI-MS spectrum of gangliosides showing the accurate mass of [M+2H]2+ precursor ion of GM2 d18:1/16:0. c. Fragmentation of precursor ion (shown in b) at NCE=26 in QExactive HF. The inset shows TMT6 reporter ion region and the respective channel assignments. Identification of each ganglioside species is based on the presence of diagnostic B1, O”, and Y0’ ions. Only 14 gangliosides in Huh-7.5 cells passed these criteria (shown in d). d. Mean relative intensities ±s.e.m. of gangliosides detected by ESI-MS in 3 independent samples of Huh-7.5 cells treated with 50 or 200 μM miglustat, each with two technical replicate analyses (4 for control samples). e. Mean relative abundance ±s.e.m. of multiple GM2 ganglioside species with varying lengths of fatty acyl tail detected by ESI-MS in 3 independent samples of Huh-7.5 cells treated with miglustat at the indicated concentration. Each sample was subjected to 2 replicate ESI-MS analyses (4 for control samples). Note that the maximum concentration of miglustat used in these experiments was over 20-fold the clinical plasma Cmax of Zavesca® (miglustat) which is approximately 9 μM [European Medicines Evaluation Agency, Scientific Discussion, 2005, https://www.ema.europa.eu/en/documents/scientific-discussion/zavesca-epar-scientific-discussion_en.pdf, accessed 28 February, 2020].

