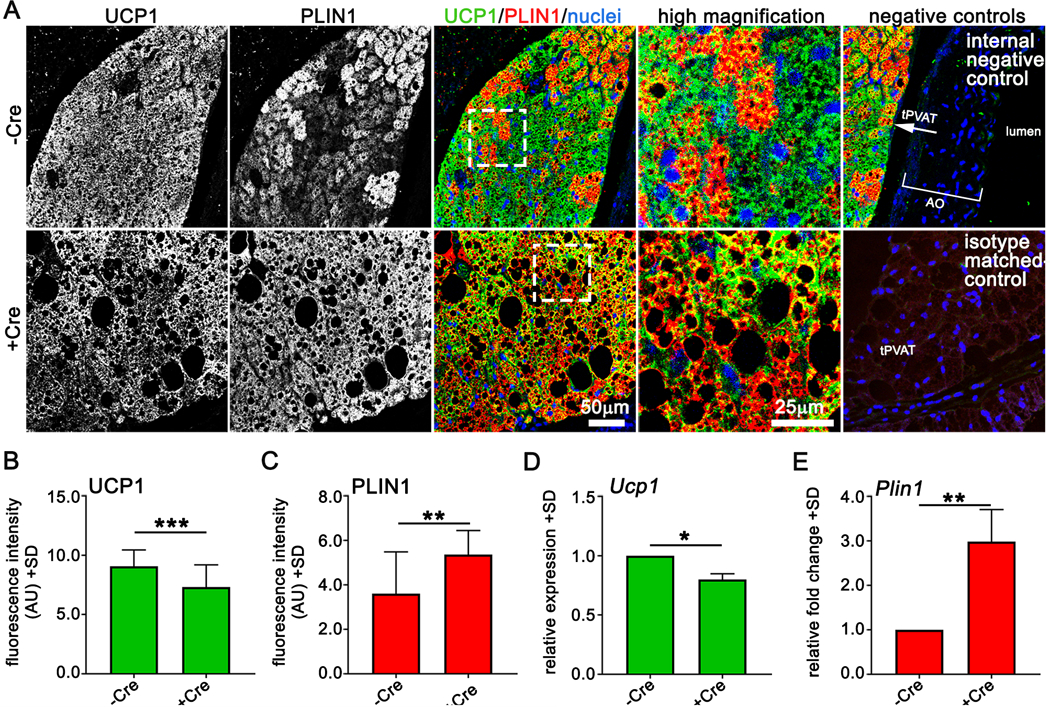
Figure 5. The effects of Notch activation on thermogenic markers in tPVAT.

A) Confocal immunofluorescence of tPVAT from -Cre or +Cre mice for indicated proteins. B-C) Fluorescence intensity of UCP1 (B) and PLIN1 (C) from tPVAT of indicated mice, n=3 mice per group. D-E) qPCR of Ucp1 and Plin1 from tPVAT of indicated mice, n=3 mice per group. Graphed are means +SD. Data were analyzed using Student’s t-test with post-hoc Tukey’s range test. *P≤0.05, **P≤0.01, ***P≤0.001.
