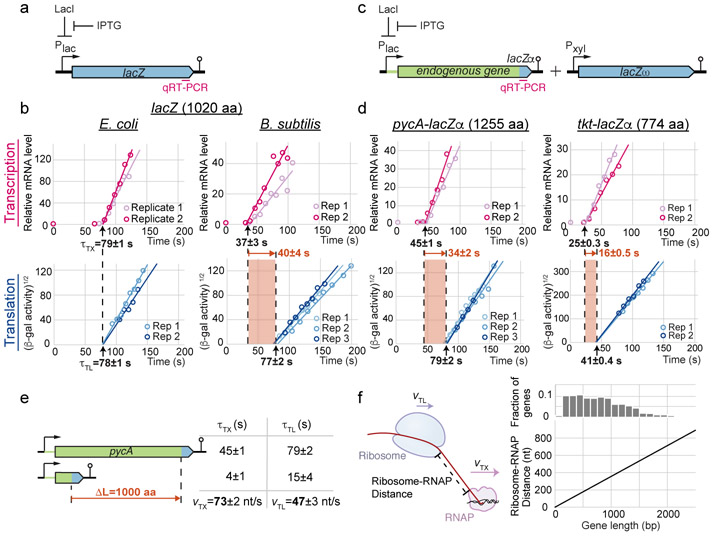
Fig. 1. Fast RNAP movement results in runaway transcription.
a, Schematic of inducible lacZ expression system in B. subtilis. Region probed by qRT-PCR is labeled in magenta. b, Induction time courses of full-length lacZ mRNA (top) and protein (bottom), measured by qRT-PCR and beta-galactosidase assays, respectively. After the first appearance times (τTX and τTL), mRNAs accumulate linearly with time whereas proteins accumulate quadratically with time. Lines indicate linear fits of transformed data after signals rise. Shaded regions indicate time difference between τTX and τTL. Uncertainties are standard error of the mean (SEM) among biological replicates (3 for B. subtilis beta-galactosidase assay, 2 for all others). c, Schematic of lacZα complementation reporter for endogenous genes. Endogenous 5’ UTR and gene are indicated in green. Pxyl: xylose promoter. d, Same as b, but for endogenous genes. Translation efficiencies for pycA and tkt are 50th and 93rd percentiles among B. subtilis genes, respectively. Three biological replicates for pycA-lacZα beta-galactosidase assay, 2 for all others. e, Table of first appearance times for truncated pycA constructs. Uncertainties are standard error of the mean (SEM) among biological replicates (2). f, Plot showing estimated terminal ribosome-RNAP distance as a function of gene length (bottom). Elongation rates are based on e, and translation initiation times are assumed to be negligible. Histogram shows distribution of gene lengths in B. subtilis (top). See also Extended Data Fig. 1-3.

