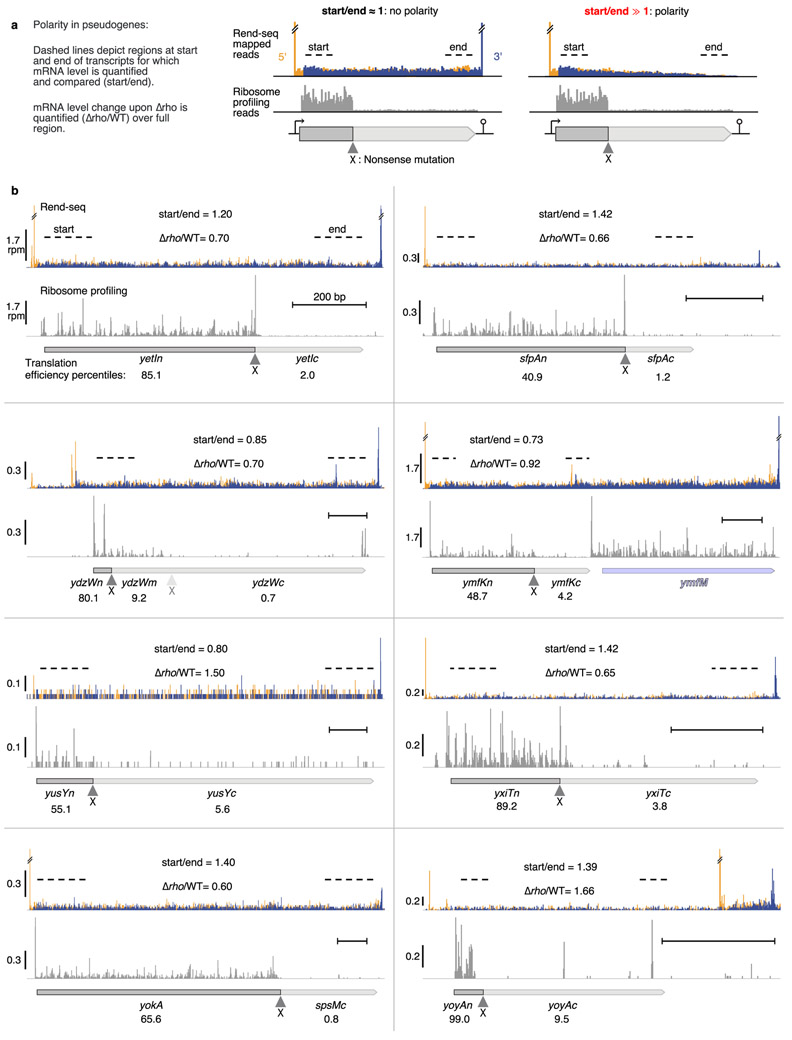
Extended Data Figure 7. Expressed pseudogenes with interrupted translation in B. subtilis show no polarity.
Expressed pseudogenes endogenously present in the extant genome were used as additional independent experiments to assess the prevalence of Rho-mediated nonsense polarity in B. subtilis in situations of obligately uncoupled transcription and translation. Concomitant Rend-seq (mapping operon architecture) and ribosome profiling (measurement of translation) provides stringent data to determine translational status and transcript integrity of mRNAs. a, Schematic of analysis: for expressed pseudogenes (see Methods for selection criteria) with translation disruption, polarity was assessed by (1) comparing the mRNA read density at start and end of transcription unit, with large changes (start/end⨠1) indicative of polarity, and (2) fold change of pseudogene transcript upon rho deletion. Position of translation disrupting mutation is shown by ▲ and X. Dark and pale gray indicates region prior and after translation disruption mutation. b, Rend-seq and ribosome profiling data for the 8 identified expressed pseudogenes. Each subpanel corresponds to a pseudogene region. Top traces show Rend-seq data (orange and blue signal correspond to summed 5’-mapped reads and 3’-mapped reads, peak shadows removed, see35 for details on data processing). Orange peaks and blue peaks mark 5’ and 3’ boundaries of transcripts. Double line breaks (//) indicate truncated Rend-seq signal at peaks. Bottom traces show ribosome profiling data. Translation efficiency (ribosome profiling rpkm/Rend-seq rpkm) percentiles for each pseudogene sub-region (before and after translation disruption) are shown. Horizontal size marker provides positional scale (200 bp) on each subpanel. Nearby intact genes are shown in light blue. rpm: reads per million. Regions used to assess start to end decrease in RNA levels are marked by dashed lines. mRNA levels fold-changes (start/end, and Δrho/WT) are shown. The ydzW region showed a second translation disruption the secondary frame, shown as a pale ▲ and X. See Methods, Fig. 3b and Supplementary Data 3 for details.

