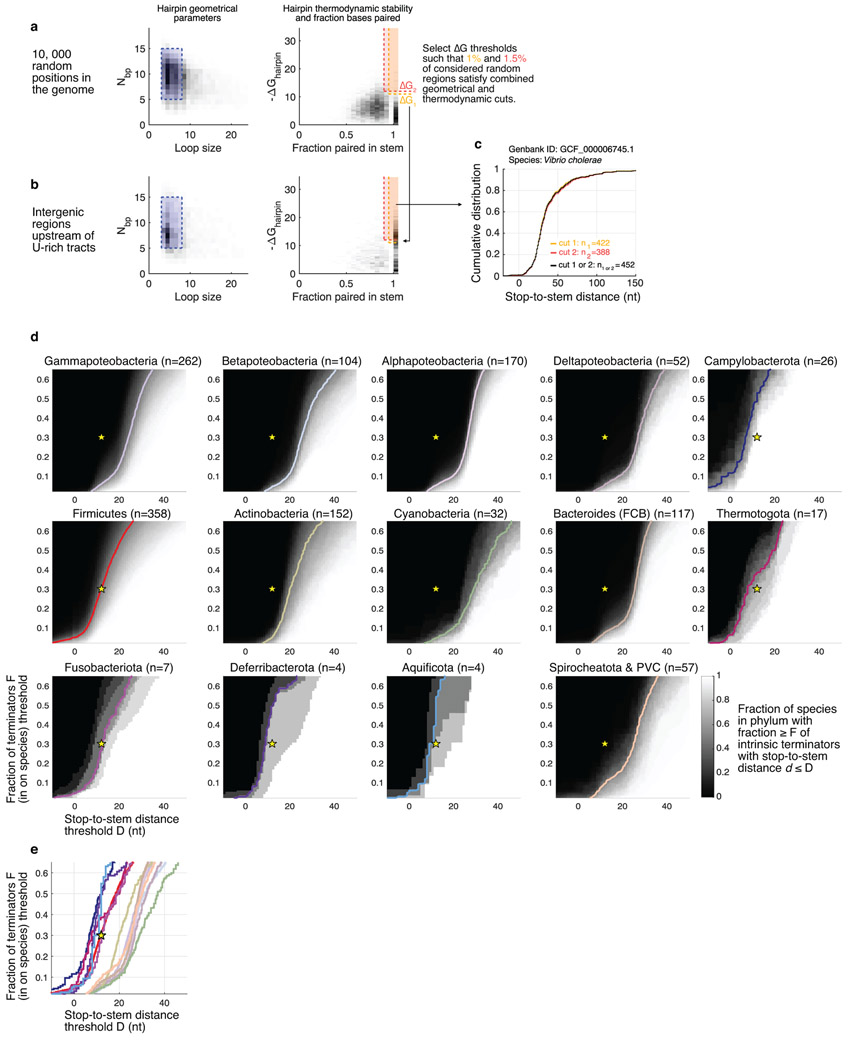
Extended Data Figure 10. Illustration of terminator identification pipeline and analysis of stem-to-stop distribution stratified by phyla.
The terminator identification pipeline selects for strong hairpins immediately upstream of long U-tract found downstream of genes. Thresholds on hairpin folding free energy are determined on a species-by-species basis based on properties of randomly selected regions in respective genomes. The case of V. choloerae is illustrated in a-c. a, Results of folding 104 regions of 40 nt chosen at random positions in the genome. Left panel shows the 2D distribution as a heatmap (dark positions corresponding to more density) of hairpin geometrical parameters (number of base pairs in stem Nbp, length of loop). Geometric thresholds are highlighted with blue dashes (5 bp ≤ Nbp ≤ 15 bp, 3 nt ≤ Loop ≤ 8 nt) and retained region by blue shading. Right panel shows the 2D distribution as a heatmap (dark positions correspond to more density) of hairpin free energy of folding ΔGhairpin and fraction of bases paired in stem f. Thresholds ΔG1 and ΔG2 on ΔGhairpin are chosen such the total fraction of hairpin from random regions meeting geometrical (blue shading in left panel) and thermodynamic thresholds are 1% (orange, ΔGhairpin ≤ΔG1 and f≥0.95) and 1.5% (red, ΔGhairpin ≤ΔG2 and f≥0.9). b, Similar as for a, but for regions seeded by U-tracts (stretch of 5 or more consecutive T’s in the genome downstream of genes). Note the excess density of hairpins with strong energy of folding and large fraction of bases paired, corresponding to putative intrinsic terminators. c, Distribution of stop-to-stem distances for terminators passing thresholds shown in b. See Supplementary Data 2, Supplementary Data 3, and Methods for details of computational pipeline. d and e, Phylum stratified analysis on the stop-to-stem distribution. d, Each subpanel shows as a 2D greyscale the fraction of species within each phylum (shown in Fig. 4) for which more than fraction F (y-axis) of terminators have stop-to-stem distances less than or equal to D (x-axis). Black regions correspond to no species in the phylum, white all species. The contour line in the (D,F) space marks points where 50% of species in the phylum have fraction ≥F of their terminators with stop-to-stem distance ≤D. The yellow stars mark the thresholds used in Fig. 4 (D=12 nt, F=30%). For example, about 50% of species analyzed in the Firmicutes have more than 30% of their terminators within 12 nt of upstream ORF (red contour line intersecting yellow star). e, The 50% species contour lines from d reported to the same panel, showing clear separation between phyla.

