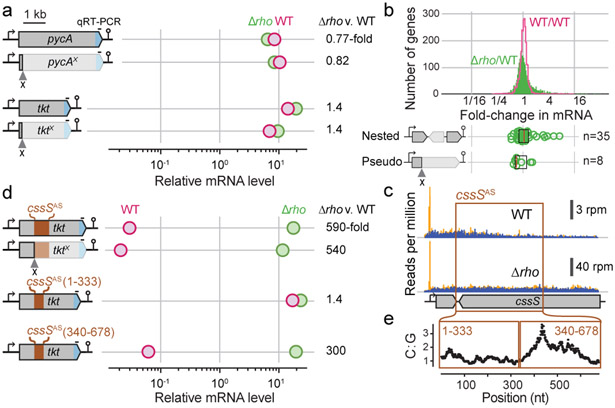
Fig. 3. Signals of Rho-dependent termination.
a, Quantification of mRNA levels with and without premature stop codons (‘x’). mRNA levels are quantified by qRT-PCR for the lacZα region (blue) relative to gyrA. Comparison of mRNA levels between cells without Rho (green) and WT (magenta) are shown. b, Distributions of mRNA level changes between two WT replicates (magenta) and between WT and Δrho (green) as measured by Rend-seq. Expression changes for asRNAs nested within operons (Extended Data Fig. 6) and pseudogenes (Extended Data Fig. 7 and 8) are indicated below. n: number of cases. Box plots are defined by median, 25th and 75th percentiles. c, Example of a Rho-terminated asRNA (cssSAS). Rend-seq data in WT and Δrho show regions of potential termination sites (orange: 5’-end mapped reads, blue: 3’-end mapped reads). d, Quantification of mRNA levels with variants of cssSAS insertions (with 7 mutations to replace in-frame stop codons with sense codons, see Supplementary Data 1 for sequence). Relative mRNA expression measured as in a. e, Quantification of C-to-G ratios (number of C residues divided by number of G residues) in 100-nt moving windows of cssSAS. See also Extended Data Fig. 6-9, Supplementary Data 3.

