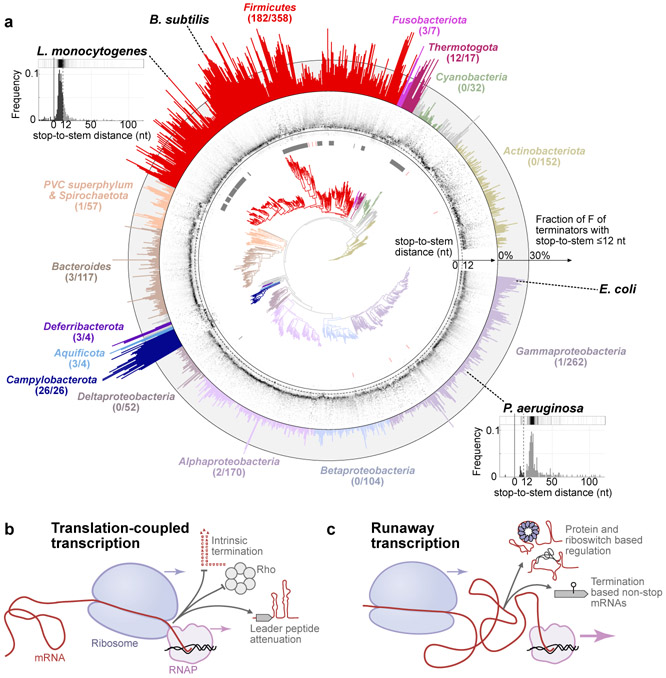
Fig. 4. Phylogenomic distribution of uncoupling.
a, Phylogenetic tree (center) is overlaid with grayscale heatmap representation of the distributions of stop-to-stem distances d for each species (middle ring, range in d shown from −20 to 120 nt). Full and dashed lines mark d=0 nt and d=12 nt respectively. The species-specific fractions F of high-confidence terminators with d≤12 nt is shown in the outer ring. Number of species per phylum with at least 30% of terminators with d≤12 nt is indicated under the phylum name. Species without Rho homologs are marked with lines next to the tree (grey: no homolog, red: partial homolog or pseudogene). The 1434 representative or reference genomes (with n≥20 identified terminators) from RefSeq are included. Tandem terminators are excluded. See Extended Data Fig. 10, Supplementary Data 4-5, Methods. Insets (L. monocytogenes, n=705 identified terminators, F=71.2% of terminators with d≤12 nt; P. aeruginosa, n = 216, F=6.9%) show representative examples of bioinformatically determined stop-to-stem distributions (c.f., Fig. 2e) with their heatmap representation (above) shown in middle ring. Dark and light portions of the histograms in insets highlight terminators with d≤12 nt and d>12 nt respectively. b and c, Schematics of transcription-coupled and runaway transcriptions and some of their respective functional consequences.

