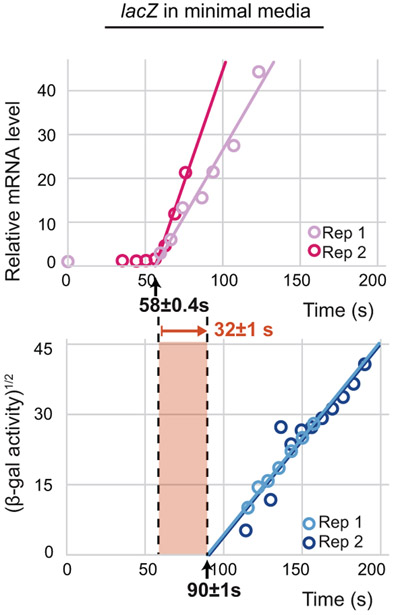
Extended Data Figure 1. Transcription and translation kinetics in slow growth.
Induction time course of lacZ mRNA (top) and protein (bottom) as in Fig. 1b, d for WT B. subtilis grown in MOPS minimal media + 0.4% maltose (growth rate 0.65 h−1). Lines indicate linear fits after signals rise. Uncertainties are standard error of the mean (SEM) among biological replicates (2).

