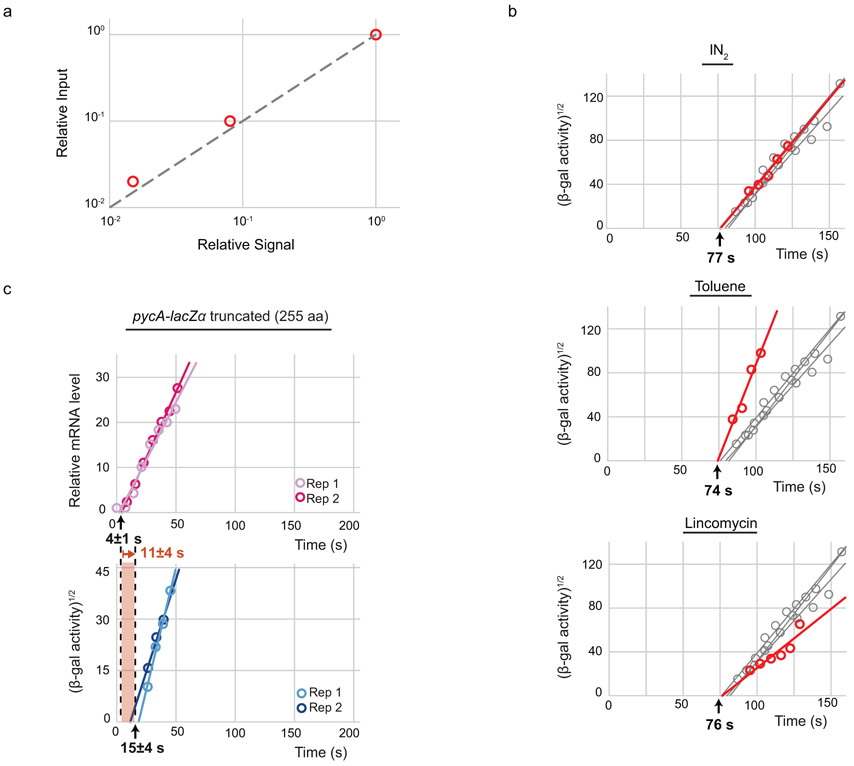
Extended Data Figure 2. Validation of β-gal assay.
a, Measurement of linear range of microplate reader. Fluorescence relative to input of dilutions of an induced culture of bGJ74 (full-length lacZ) at steady-state. See Methods. b, Effect of different stop solutions on stopping translation. Induction time courses of pycA-lacZα protein collected into a stop solution containing chloramphenicol and erythromycin (grey, all plots, from Fig. 1d) or with either flash freezing in liquid nitrogen (top), 15 μL toluene added to the stop solution (middle), or 50 μL 12.5 mg/mL lincomycin added to the stop solution (bottom), shown in red in each plot (as described in Methods). Lines indicate linear fits after signals rise and τTL is indicated. c, Induction time course of truncated pycA-lacZα mRNA (top) and protein (bottom) as in Fig. 1b, d. Lines indicate linear fits after signals rise. Uncertainties are standard error of the mean (SEM) among biological replicates (2).

