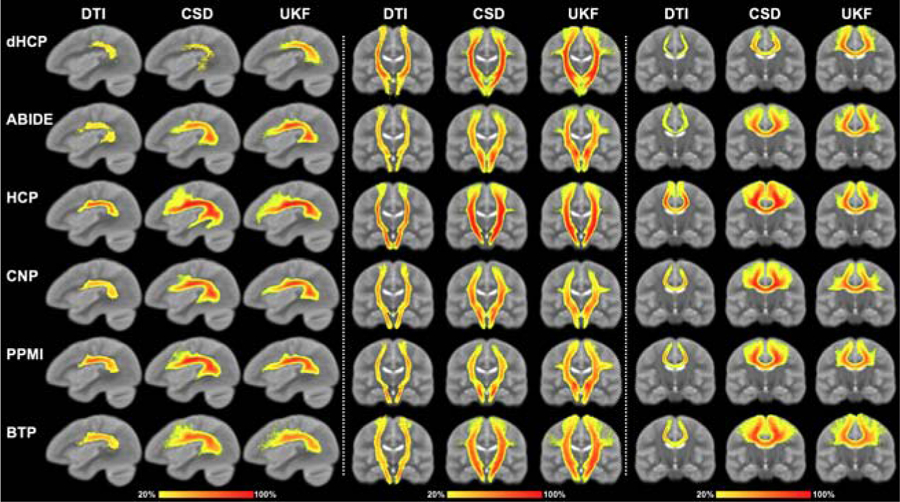
Figure 6:

Voxel-based population tract heatmaps of three example tracts (AF, CST and CC4, respectively) obtained by applying DeepWMA on tractography data computed using the DTI, CSD and UKF fiber tracking methods. The value of each voxel in the heatmaps represents the percentage of subjects that have fibers passing through the voxel (see colorbar). The background image is the ORG atlas population mean T2 image.
