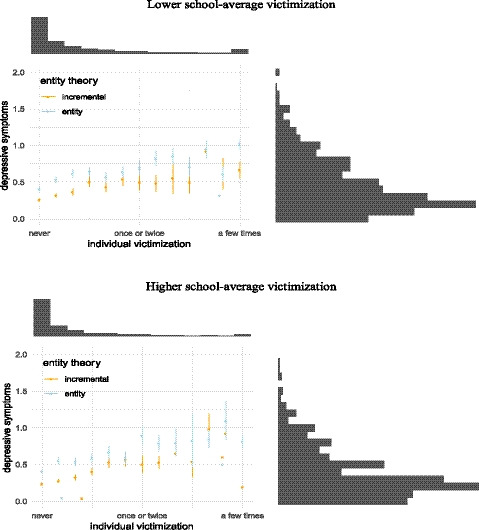
Figure A1.

Graphic Representation of the Data Distribution in Both School Contexts (No Covariates Included). Note. We collapsed the answer categories of the victimization scale from “a few times” to “a few times per week” into one category because there were only a few observations in these highest categories.
