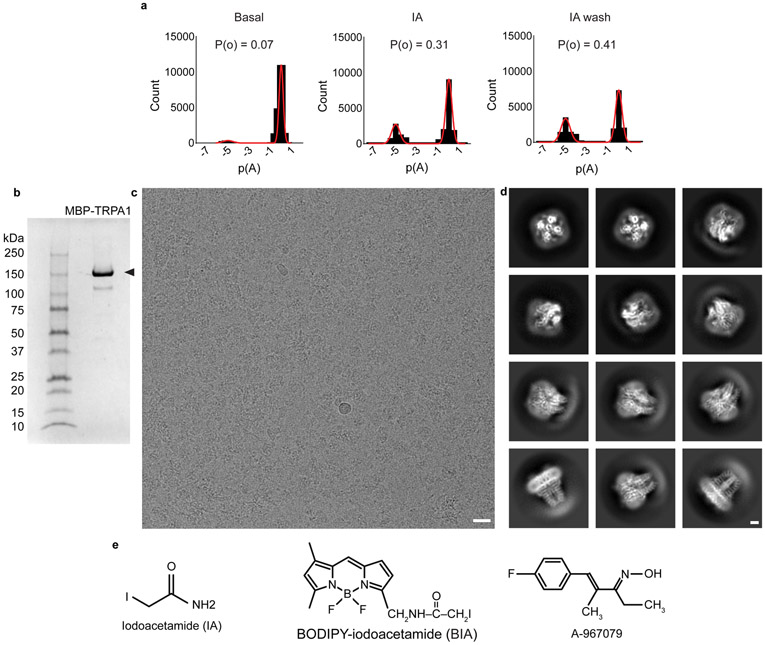
Extended Data Fig. 1. Pharmacology and cryo-EM data collection and processing for TRPA1.
a, All points histograms depicting the change in open probability (P(o)) in a single TRPA1 channel in response to IA-application. Data represent n = 9 independent excised inside-out patches. Vhold = −40 mV. b, SDS-PAGE showing MBP-TRPA1 (arrowhead) after pull-down and elution from amylose beads. c, Cryo-EM image of MBP-TRPA1. Scale bar: 20 nm. d, 2D classification of cryo-EM particle images showing TRPA1 in different orientations. Scale bar: 25 Å. e, Pharmacological agents used in this study.

