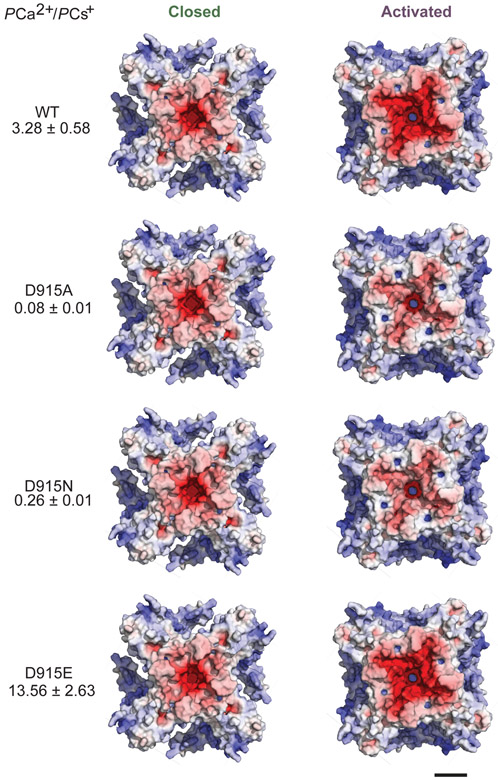
Extended Data Fig. 3. Surface charge distribution of TRPA1's extracellular face.
Electrostatic potential maps were calculated in APBS and are displayed at ± 10 kT/e−. In silico mutations of D915 were modeled and experimentally determined relative permeability ratios for these mutations sourced from Wang et al. (ref. 13). Scale bar: 30Å.

