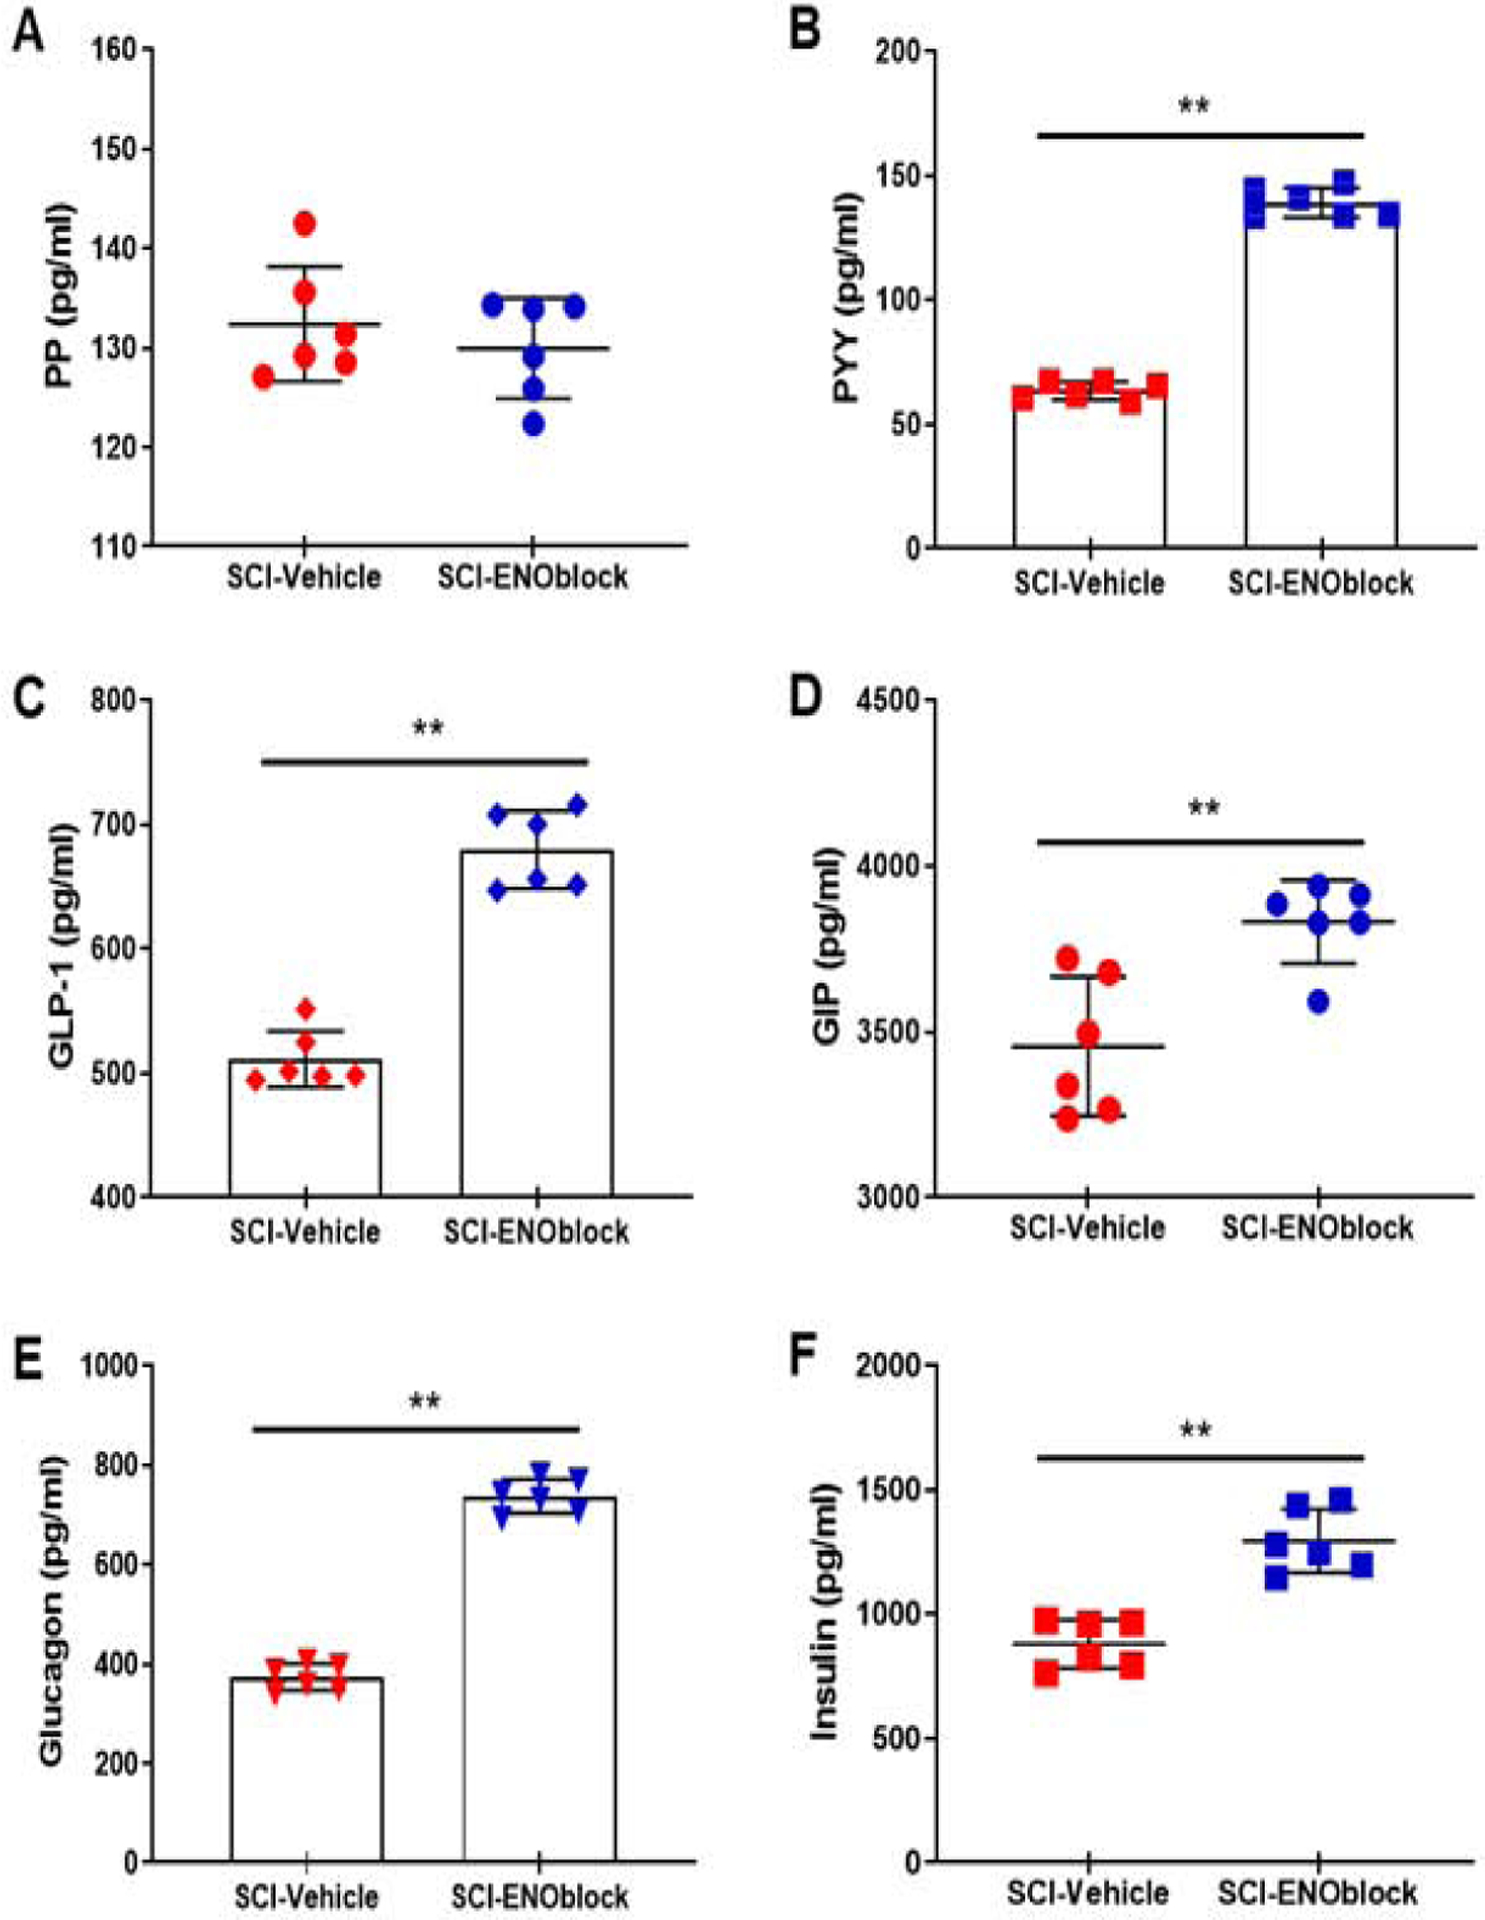
Fig. 2.

Effects of ENOblock treatment on several key metabolic factors after SCI in rats. SCI rats were treated with vehicle alone or ENOblock (100 μg/kg given 15min, 24h, and 3d post-injury via intravenous tail vein injection), and blood samples were obtained at sacrifice, 7d post-injury. Sham operated rats (T10 laminectomy) were used as controls. Samples were analyzed by using Eve Tech’s Mouse, Rat Metabolic Array (MRDMET) Discovery Assay. (A-B) Pancreatic polypeptide (PP) and peptide tyrosine tyrosine (PYY). PP concentrations in plasma samples were not significantly changed by ENOblock treatment. Median concentrations in SCI-vehicle and SCI-ENOblock treated groups were 130.3 and 131.6 pg/ml respectively; the distributions in the two groups did not differ significantly (Mann–Whitney U = 14, n1 = n2 = 6,). PYY levels were significantly increased in ENO-treated rats as compared to vehicle treated rats. Median concentrations in SCI-vehicle and SCI-ENOblock treated groups were 63.81 and 137.8 pg/ml respectively; the distributions in the two groups differed significantly (Mann–Whitney U = 0, n1 = n2 = 6, **p < 0.01 two-tailed). (C-D) Glucagon-like peptide-1 (GLP-1) and glucose-dependent insulinotrophic polypeptide (GIP). Plasma levels of GLP-1 in ENO-treated SCI rat samples were significantly increased as compared to vehicle treated rats. Median concentrations in SCI-vehicle and SCI-ENOblock treated groups were 500.1 and 678.3 pg/ml respectively; the distributions in the two groups differed significantly (Mann–Whitney U = 0, n1 = n2 = 6, **p < 0.01 two-tailed). ENOblock treatment increased GIP levels after SCI in rats. Median concentrations in SCI-vehicle and SCI-ENOblock treated groups were 3416 and 3858 pg/ml respectively; the distributions in the two groups differed significantly (Mann–Whitney U =2, n1 = n2 = 6, **p < 0.01 two-tailed). (E-F) Glucagon and insulin. ENOblock treatment increased glucagon levels significantly as compared with vehicle treated SCI rats. Median concentrations in SCI-vehicle and SCI-ENOblock treated groups were 374.3 and 737.3 pg/ml respectively; the distributions in the two groups differed significantly (Mann–Whitney U = 0, n1 = n2 = 6, **p < 0.01 two-tailed). (B) ENOblock treatment significantly increased insulin levels as compared with vehicle treated SCI rats. Median concentrations in SCI-vehicle and SCI-ENOblock treated groups were 893.2 and 1264 pg/ml respectively; the distributions in the two groups differed significantly (Mann–Whitney U = 0, n1 = n2 = 6, **p < 0.01 two-tailed).
