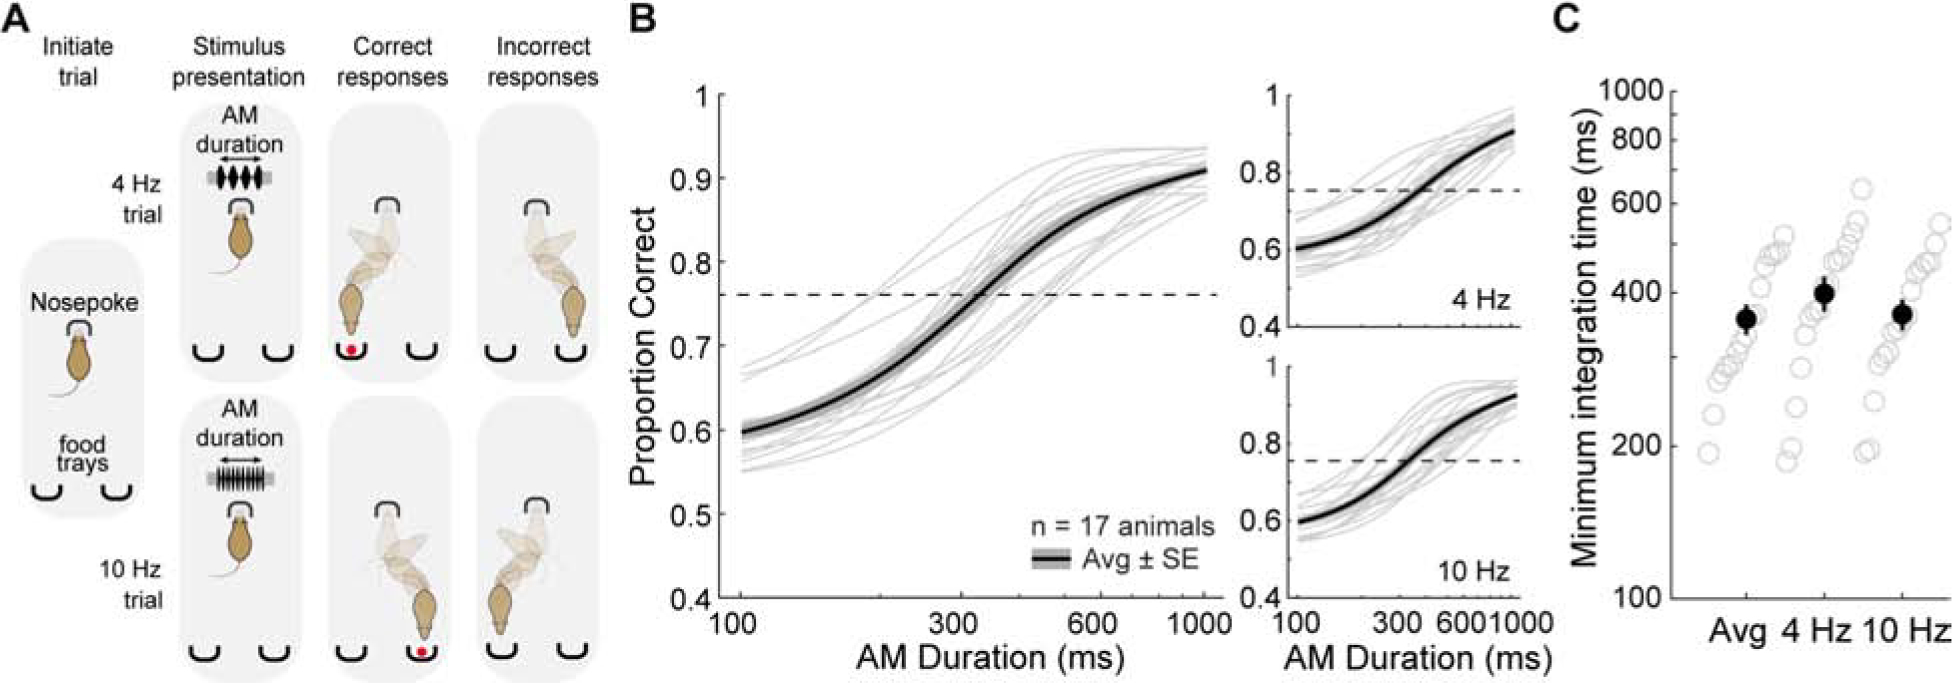
Figure 1. Behavioral measures of auditory integration time.

A) Schematic of the auditory integration task, a two-alternative forced choice AM noise discrimination task. Gerbils are required to discriminate between AM noise at 4 versus 10 Hz across a range of stimulus durations (100–2000 ms). B) Psychometric functions from the average of all animals (thin lines). Thick lines represent the overall average across all animals and the shaded region represents average ± SE. C) Distribution of calculated minimum integration times from each animal across separate trial types. See also Figure S1.
