
Fig. 3 |. Gene expression and chromatin accessibility of amplicon classes.
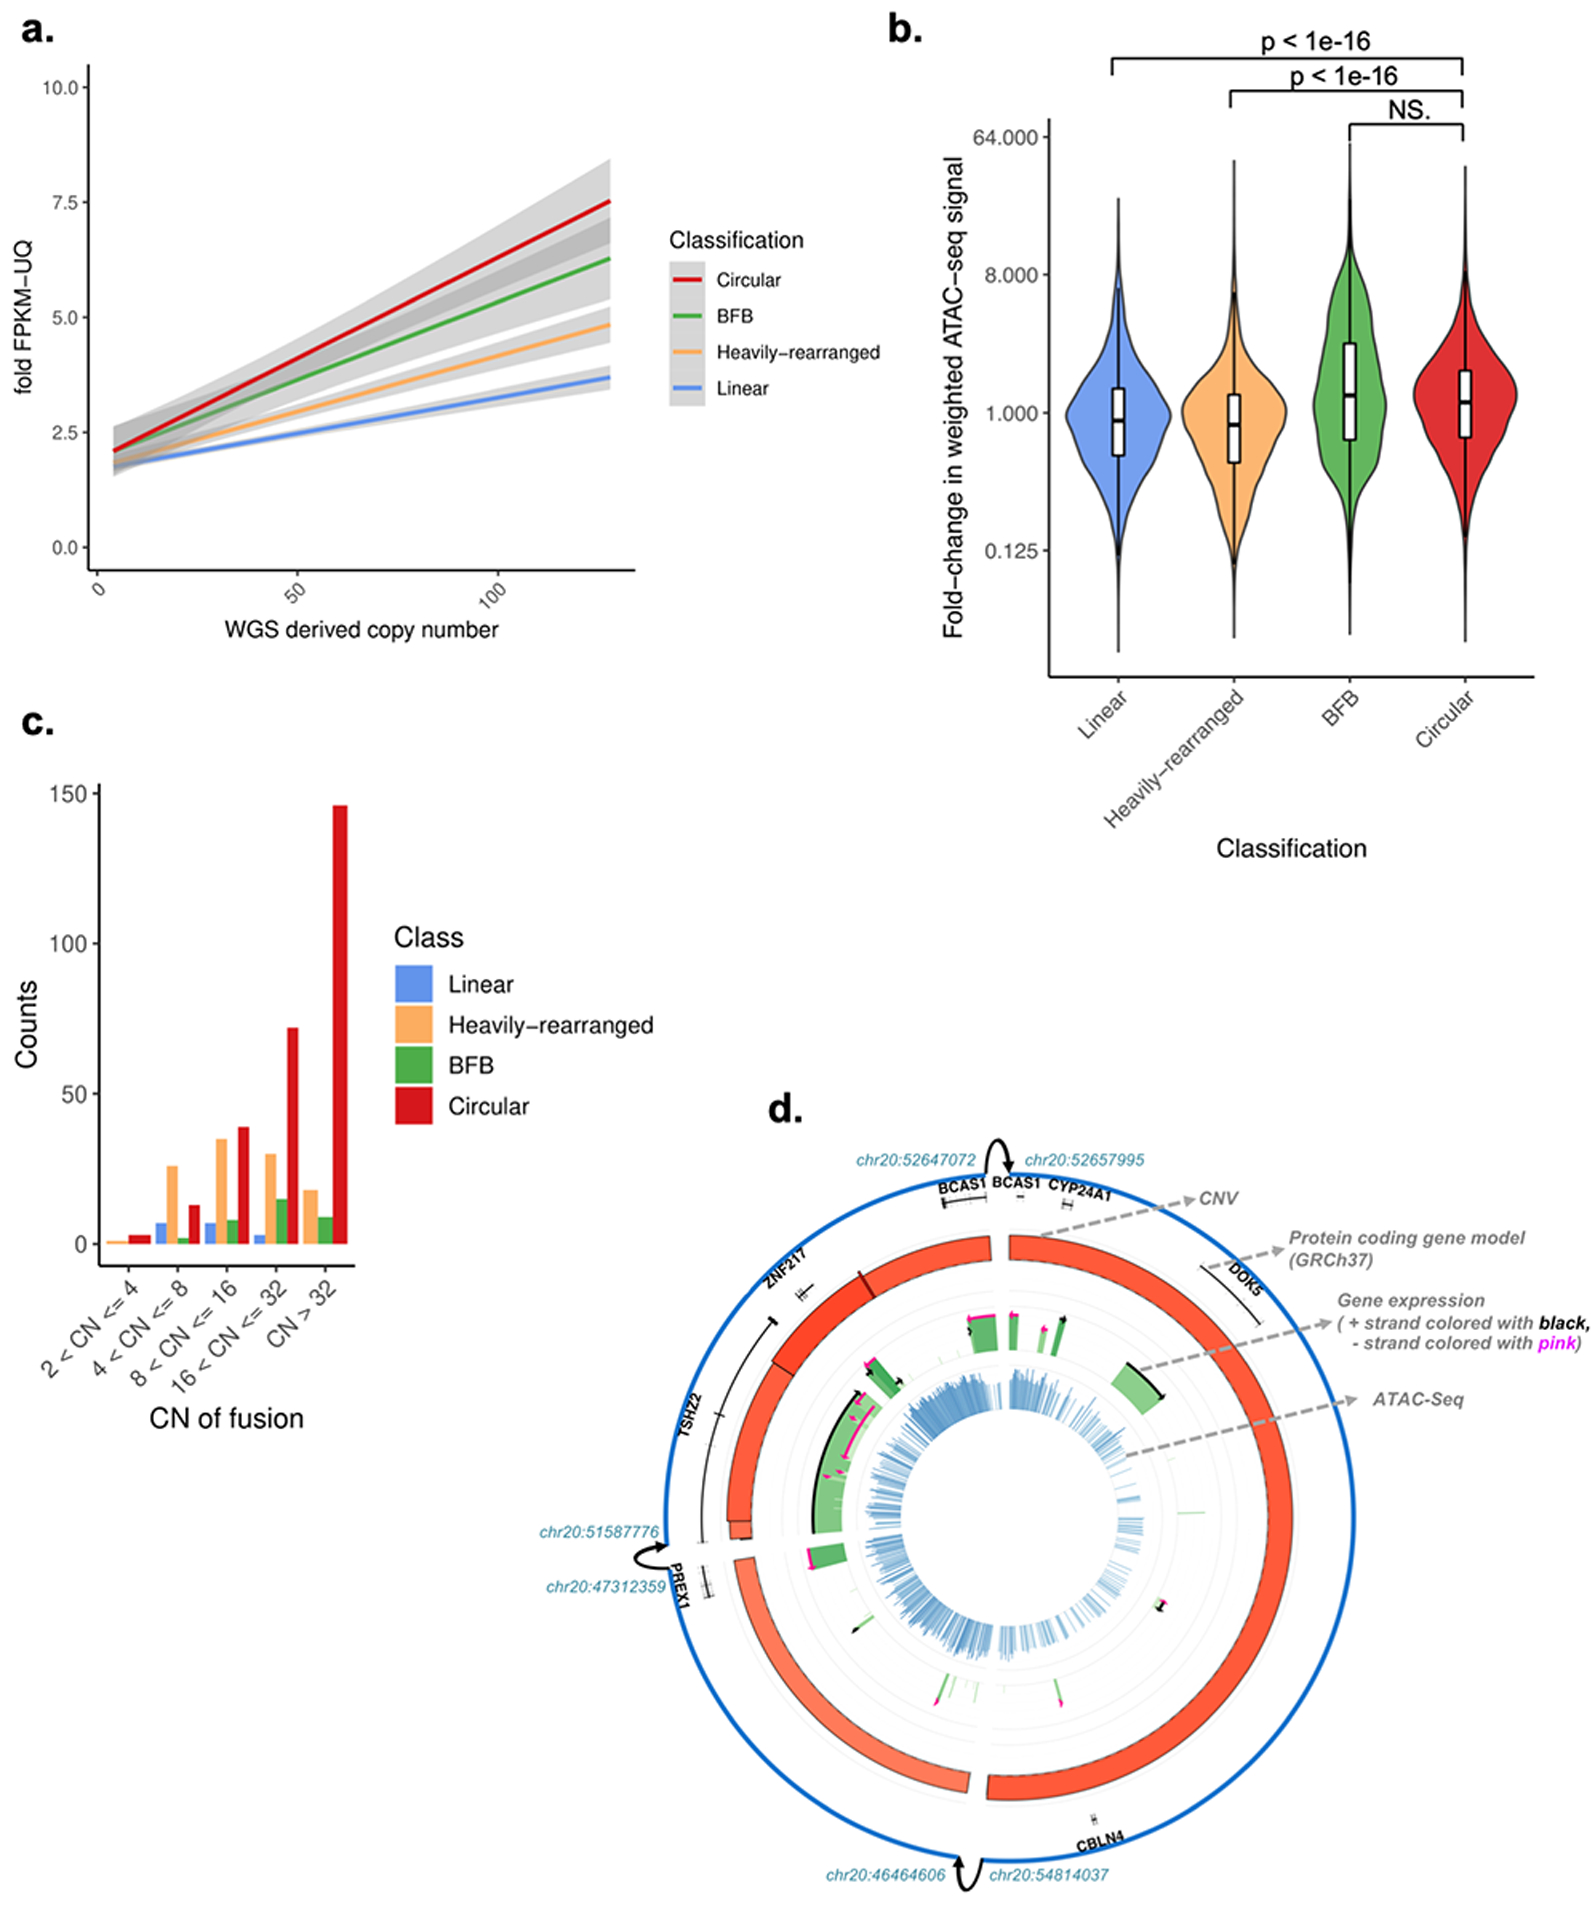
A. Copy number of oncogene versus its fold-change in Fragments Per Kilobase of transcript per Million mapped reads upper quartile (FPKM-UQ) for all oncogenes with a copy count greater than 4, for each oncogene on each amplicon. The fold-change in FPKM-UQ is computed as the oncogene’s (FPKM-UQ+1) divided by the average of (FPKM-UQ+1) for the same oncogene in all other tumor samples from the same cohort for which the oncogene is not on any amplicon (i.e., not amplified). Linear regression lines, using fold change = m*copy number+b, and their 95% confidence level intervals (in grey) are shown for each class. Tukey’s range test shows oncogenes on circular structures are significantly different to oncogenes on non-circular structures (p-value < 1e-7). WGS: whole-genome sequencing. B. For each of the 36 The Cancer Genome Atlas (TCGA) samples with Assay for Transposase-Accessible Chromatin using sequencing (ATAC-seq) profiles and AmpliconArchitect results, the copy-number normalized fold-change in ATAC-seq signal in each ATAC-seq peak that overlaps with the amplicon relative to tissue types without amplification within the same peak is shown. The distribution of fold-change for Circular amplicons is statistically significantly higher than Linear and Heavily-rearranged amplicons (Wilcoxon rank sum test (two-sided); p-value < 1e-16). Y-axis is on log(2) scale. Box plots are defined as 25th, 50th and 75th percentiles, respectively. Y-axis is on log(2) scale. NS: not significant. C. Circular structures expressed significantly more gene fusions compared to non-circular amplicons, after size normalization. CN: copy number. D. Representative Circos-plot showing (rings from outside to inside) 1) Amplicon regions identified by AmpliconArchitect, where interconnected breakpoints were indicated with arrows; 2) DNA copy-number, where height and color represent level (darker red means higher copy number amplification); 3) FPKM expression values in green, where height and color represent expression level (darker green means higher expression); 4) ATAC-seq chromatin accessibility in blue, where height and color represent expression level (darker blue means more accessible). CNV: Copy Number Variation.