
Extended Data Fig. 4. Gene expression of amplicon classes.
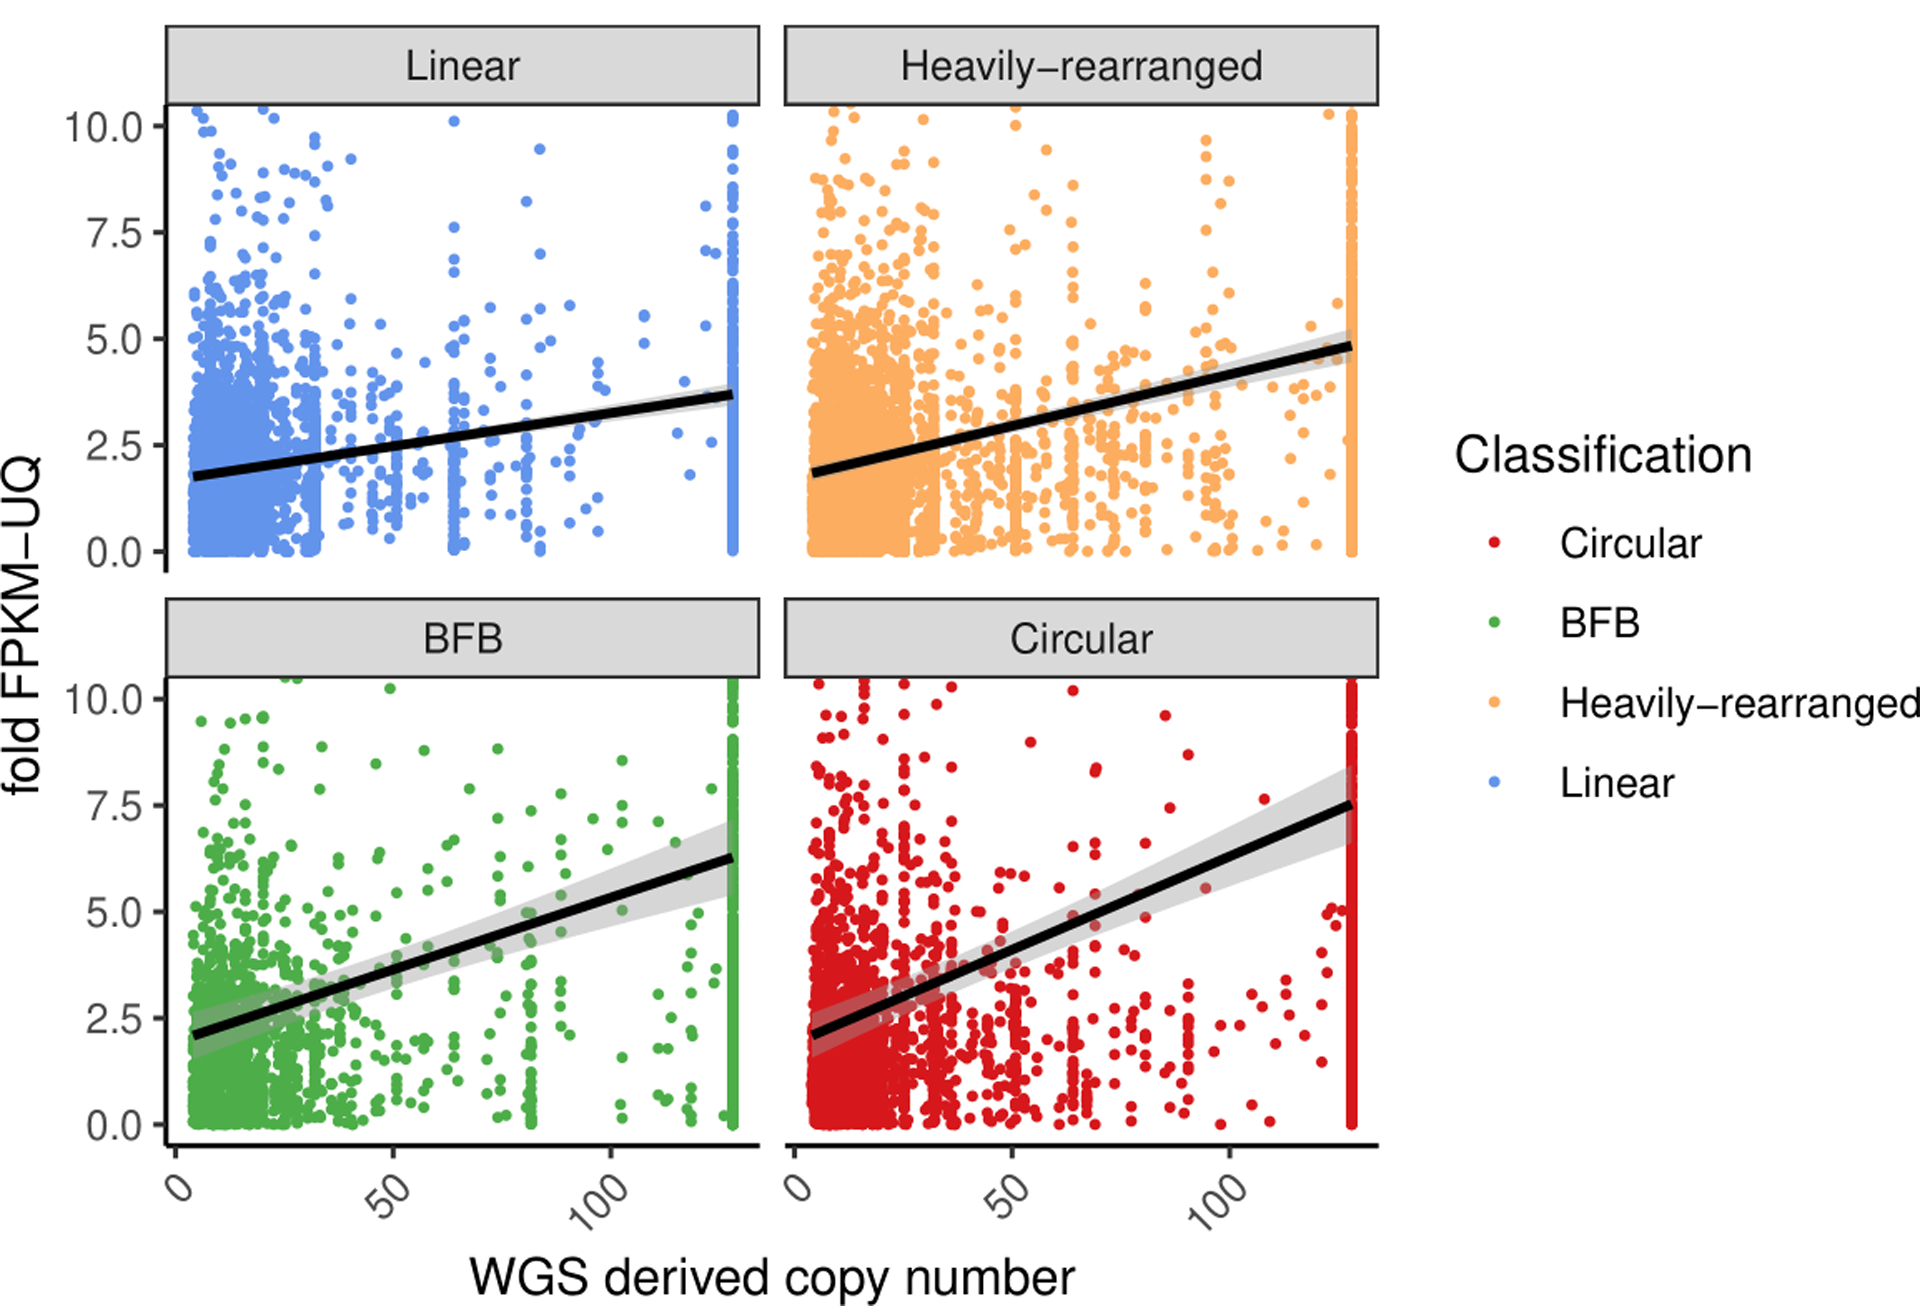
Copy number of the oncogene versus its fold-change in FPKM for all oncogenes with a copy count greater than 4, for each oncogene on each amplicon. The fold-change in FPKM is computed as the oncogene’s (FPKM-UQ+1) divided by the average of (FPKM-UQ+1) for the same oncogene in all other tumor samples from the same cohort for which the oncogene is not on any amplicon (i.e., not amplified). Linear regression lines, using fold change = m*CNV+b where m and b are selected to minimize error of the fit, are shown for each class. Tukey′s range test shows oncogenes on circular structures are significantly different to oncogenes on non-circular structures (p-value < 1e-7).