
Figure 2. Wistar rats reperfusion cerebral blood flow and stroke outcome analysis.
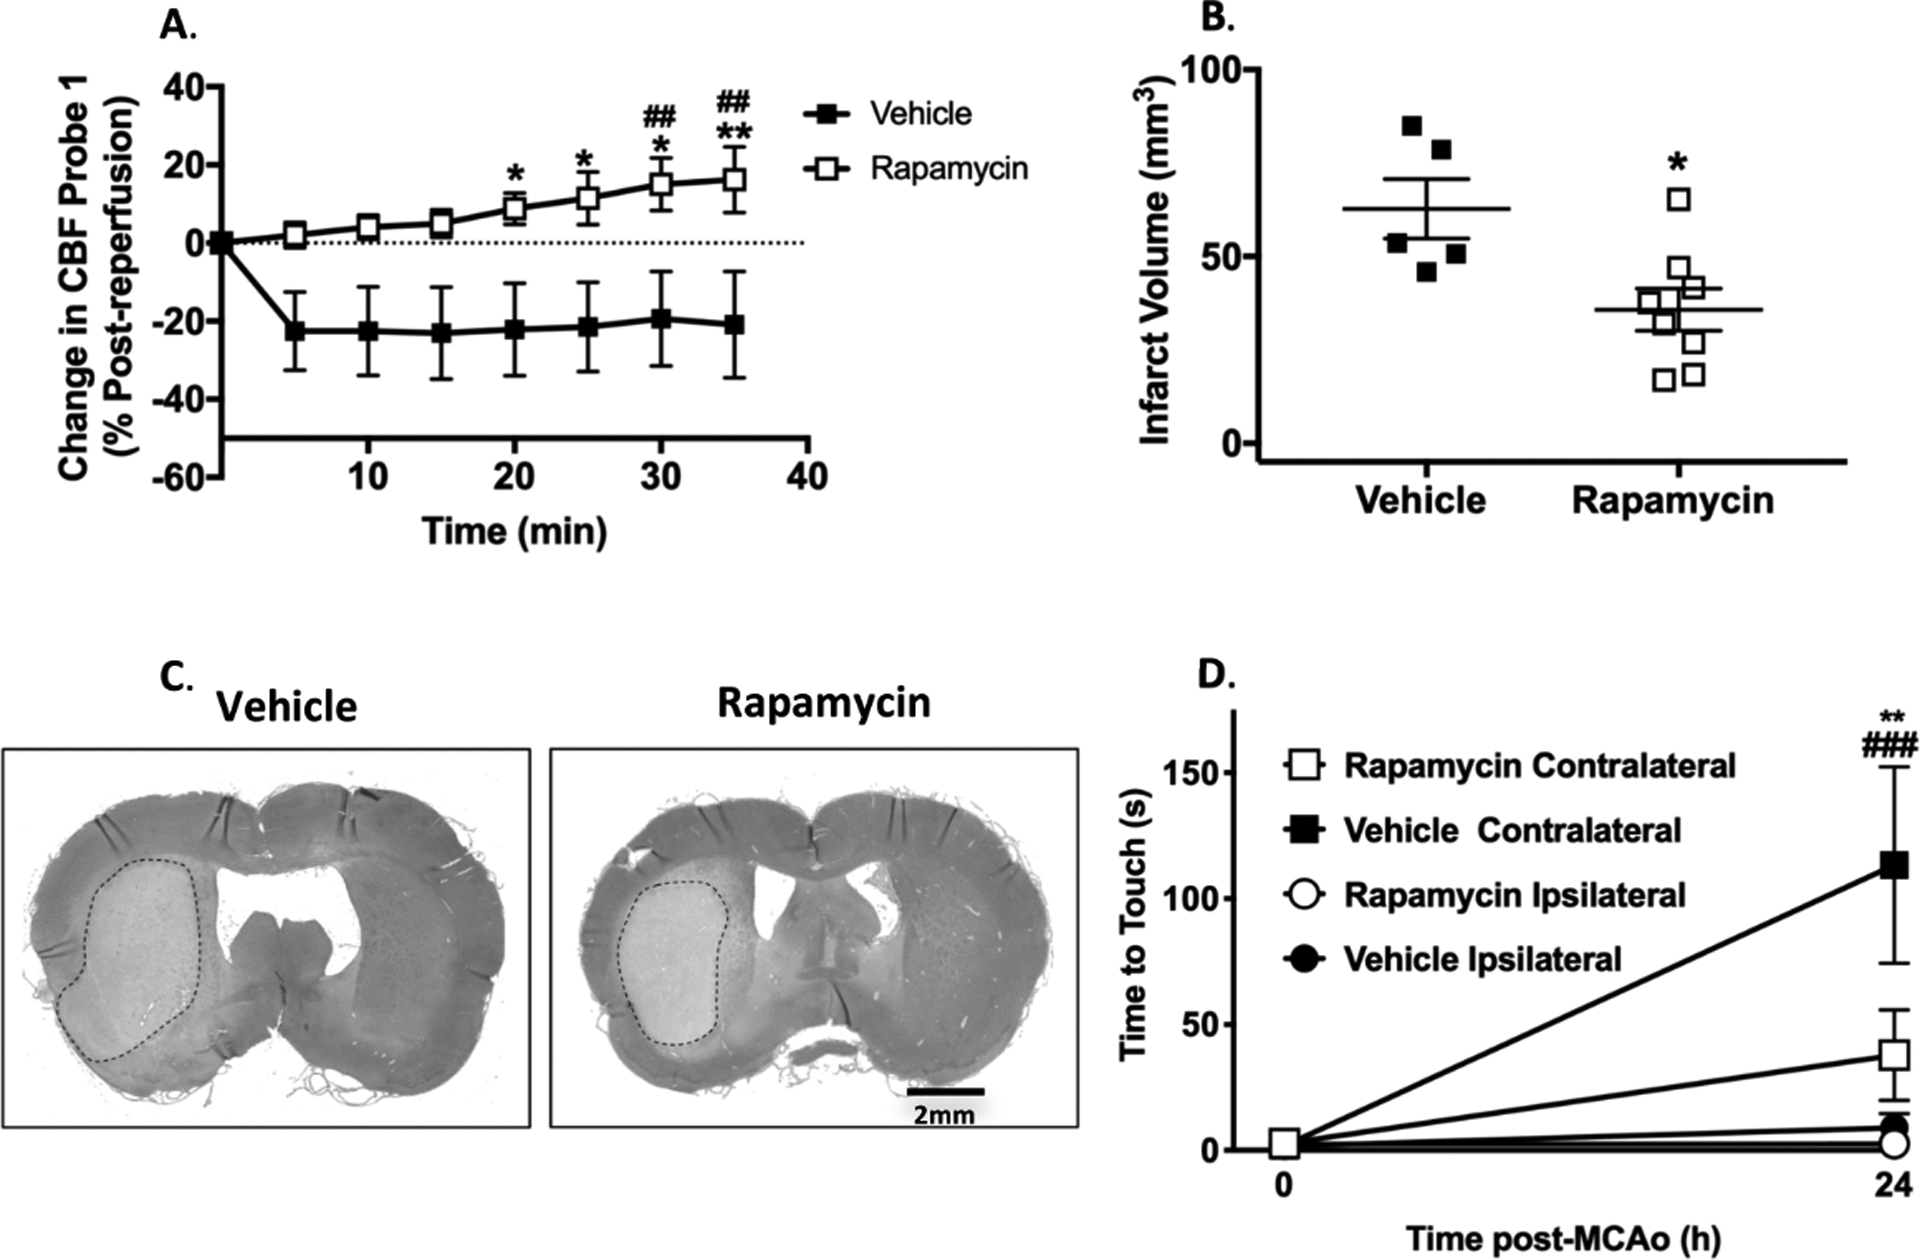
A. Change in middle cerebral artery (MCA) cerebral blood flow calculated as % change post- reperfusion (95 min post-MCAo). RM 2-Way ANOVA: F (1, 64) = 49.11, p < 0.0001 for treatment, F (7, 64) = 0.4979, p = 0.83 for time, F (7, 64) = 1.15, p = 0.35 for interaction. *p < 0.05, ** p < 0.01 vs. vehicle, Sidak’s post-test. ## p < 0.01 vs. post-reperfusion baseline in rapamycin group, Dunnett’s post-test. B. Infarct volume at 24 h post-MCAo. *p < 0.05 vs. vehicle, unpaired t-test. C. Representative histological hematoxylin and eosin stains for infarct volume. D. Time to touch in adhesive removal test at pre-MCAo baseline and 24 h after MCAo. RM 2-Way ANOVA: F (3, 22) = 6.253, p < 0.001 for treatment, F (1, 22) = 16.32, p < 0.01 for time, F (3, 22) = 6.375, p < 0.01 for interaction. **p < 0.01 rapamycin contralateral vs. vehicle contralateral, Tukey’s post-test. ### p < 0.001 vs. pre-MCAo baseline in vehicle group, Sidak’s post-test.