
Figure 3. Spontaneously Hypertensive Rats (SHRs) studies.
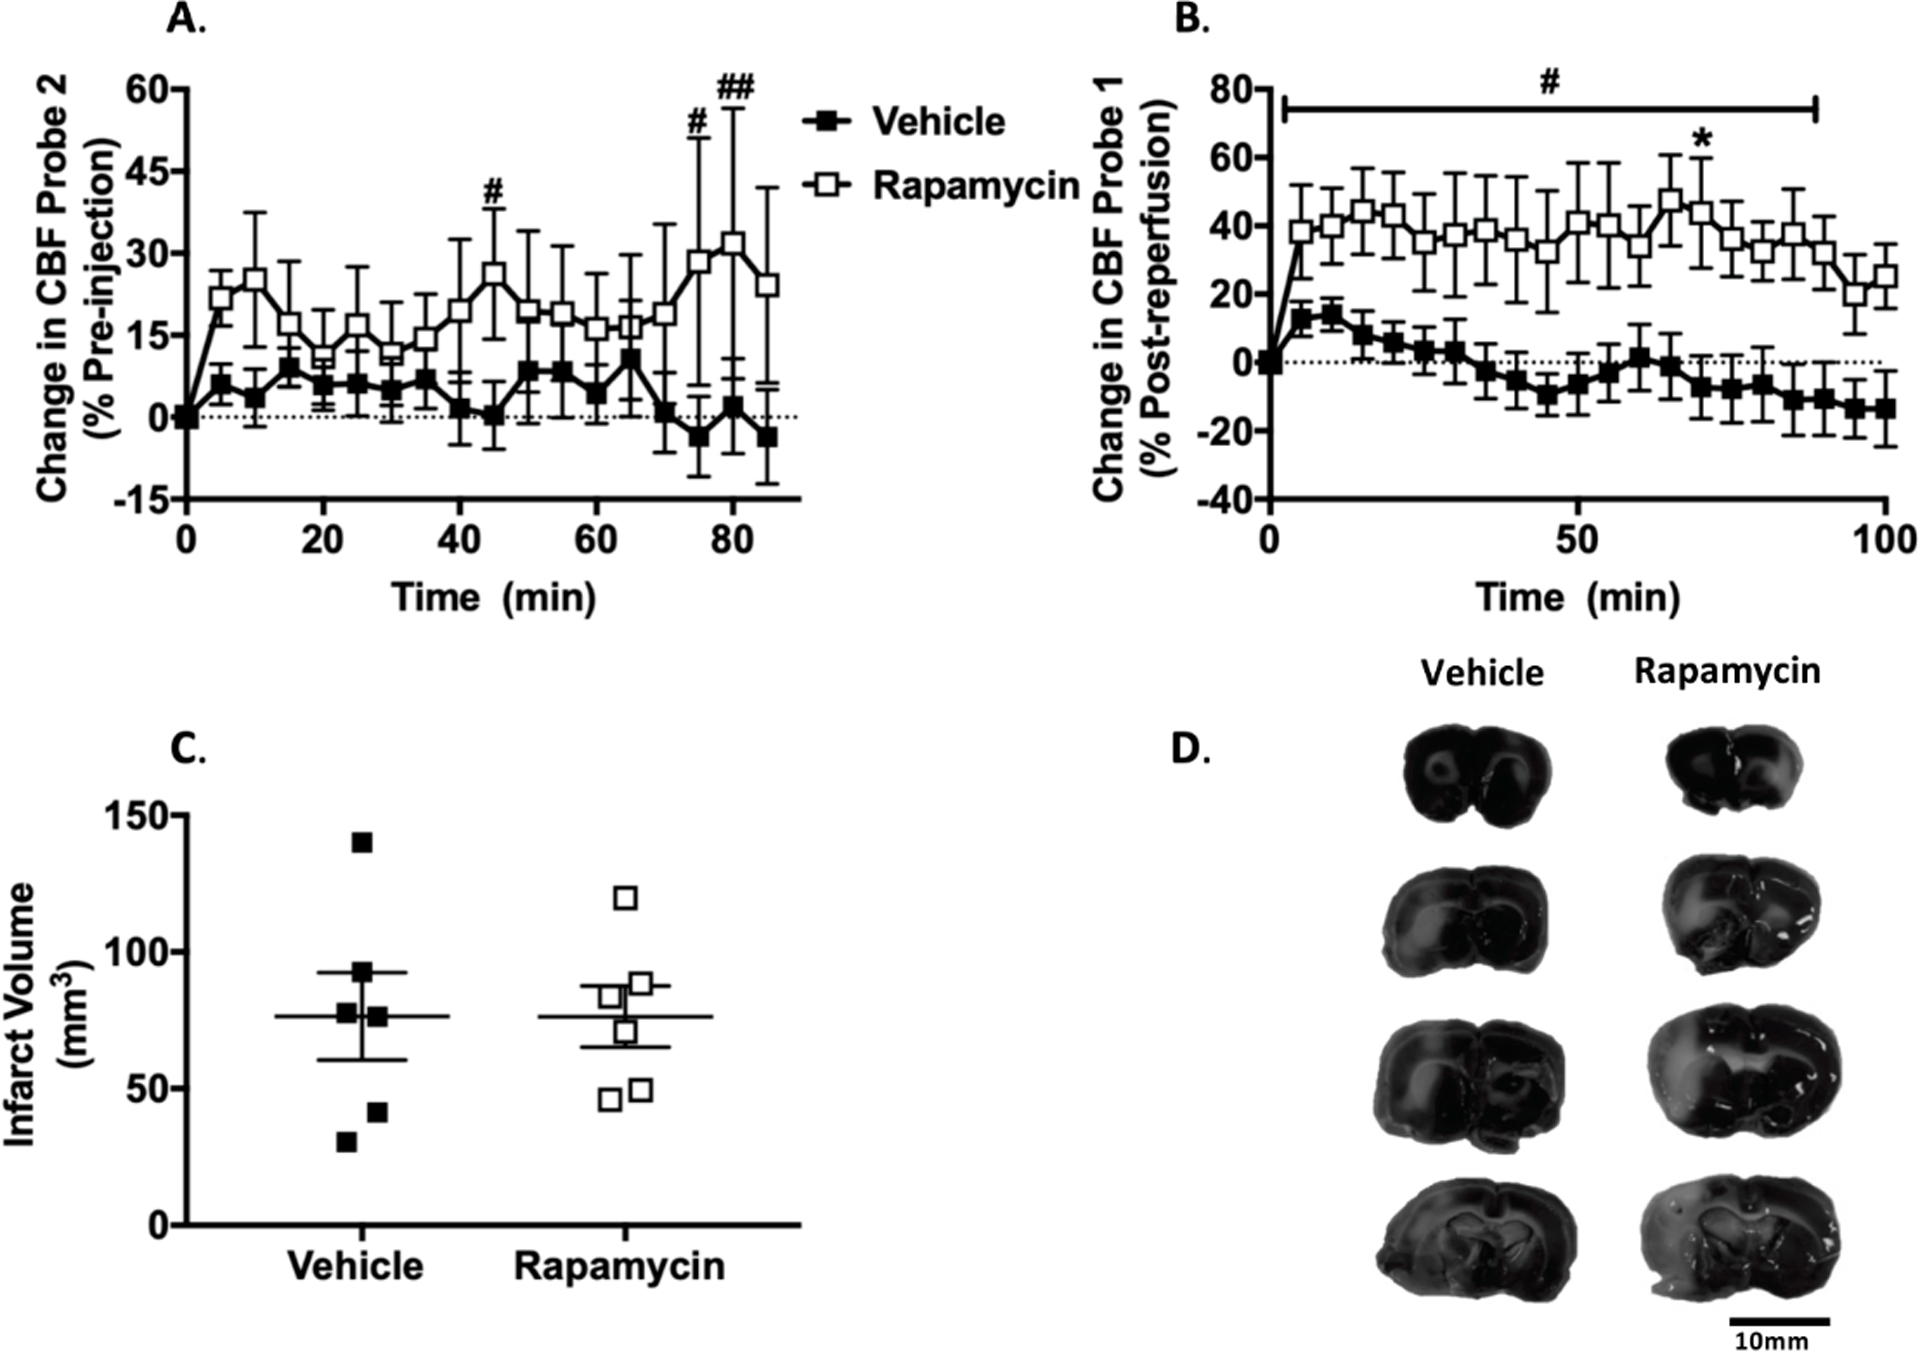
A. Change in leptomeningeal anastomoses cerebral blood flow (CBF) calculated as % change from prior to treatment at 30min after middle cerebral artery occlusion (MCAo). RM 2-Way ANOVA: F (1, 10) = 1.403, p > 0.05 for treatment, F (17, 170) = 0.6585, p > 0.05 for time, F (17, 170) = 1.102, p > 0.05 for interaction. # p < 0.05, ## p < 0.01 vs. pre-injection baseline in rapamycin group, Dunnett’s post-test. B. Change in MCA CBF calculated as % change from reperfusion (125 min post-MCAo). RM 2-Way ANOVA: F (1, 10) = 8.433, p < 0.05 for treatment, F (20, 200) = 2.113, p < 0.01 for time, F (20, 200) = 1.202, p > 0.05 for interaction.* p < 0.05 vs. vehicle, RM 2-Way ANOVA, Sidak’s post-test. # p < 0.05 vs. post-reperfusion baseline in rapamycin group, RM 2-Way ANOVA, Dunnett’s post-test. C. Infarct volume at 4 h post-MCAo. D. Representative TTC stains.