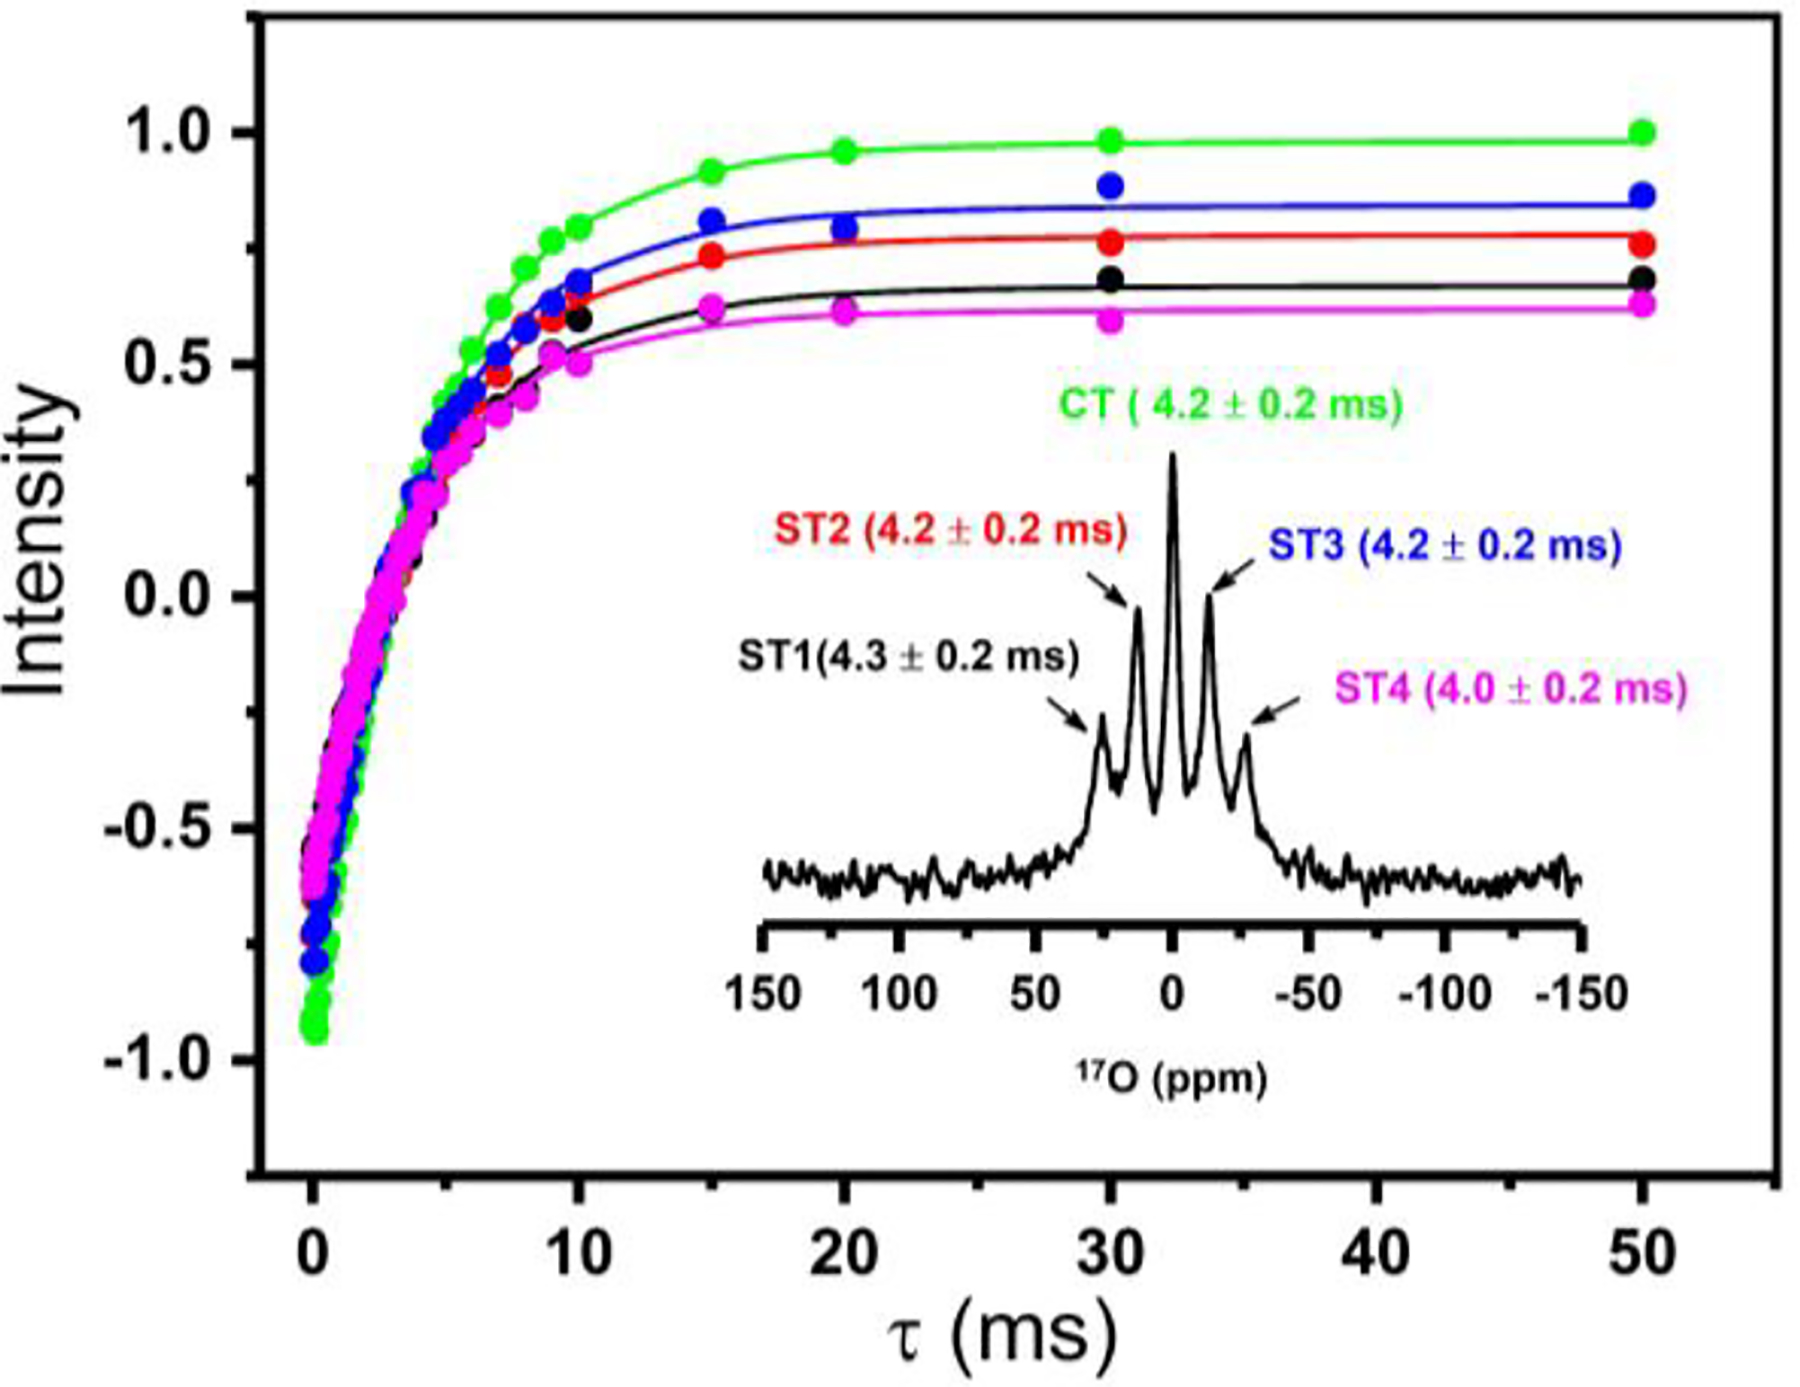
Figure 3. T1 relaxation of 17O NMR transitions.

17O spin-lattice (T1) relaxation for the central (CT) and satellite transitions (ST1, ST2, ST3, ST4) measured from SMAQA-DMPC (30% w/v) nanodiscs containing a 2 mM YbCl3. 17O NMR spectrum labelled with the transitions and the measured T1 values (inset). T1 values were obtained from the best-fitting of the inversion-recovery intensities (data points). See Figure S2 for 17O T1 experimental data obtained from isotropic water, and Figure S3 for 17O inversion recovery NMR spectra of water present in nanodiscs.
