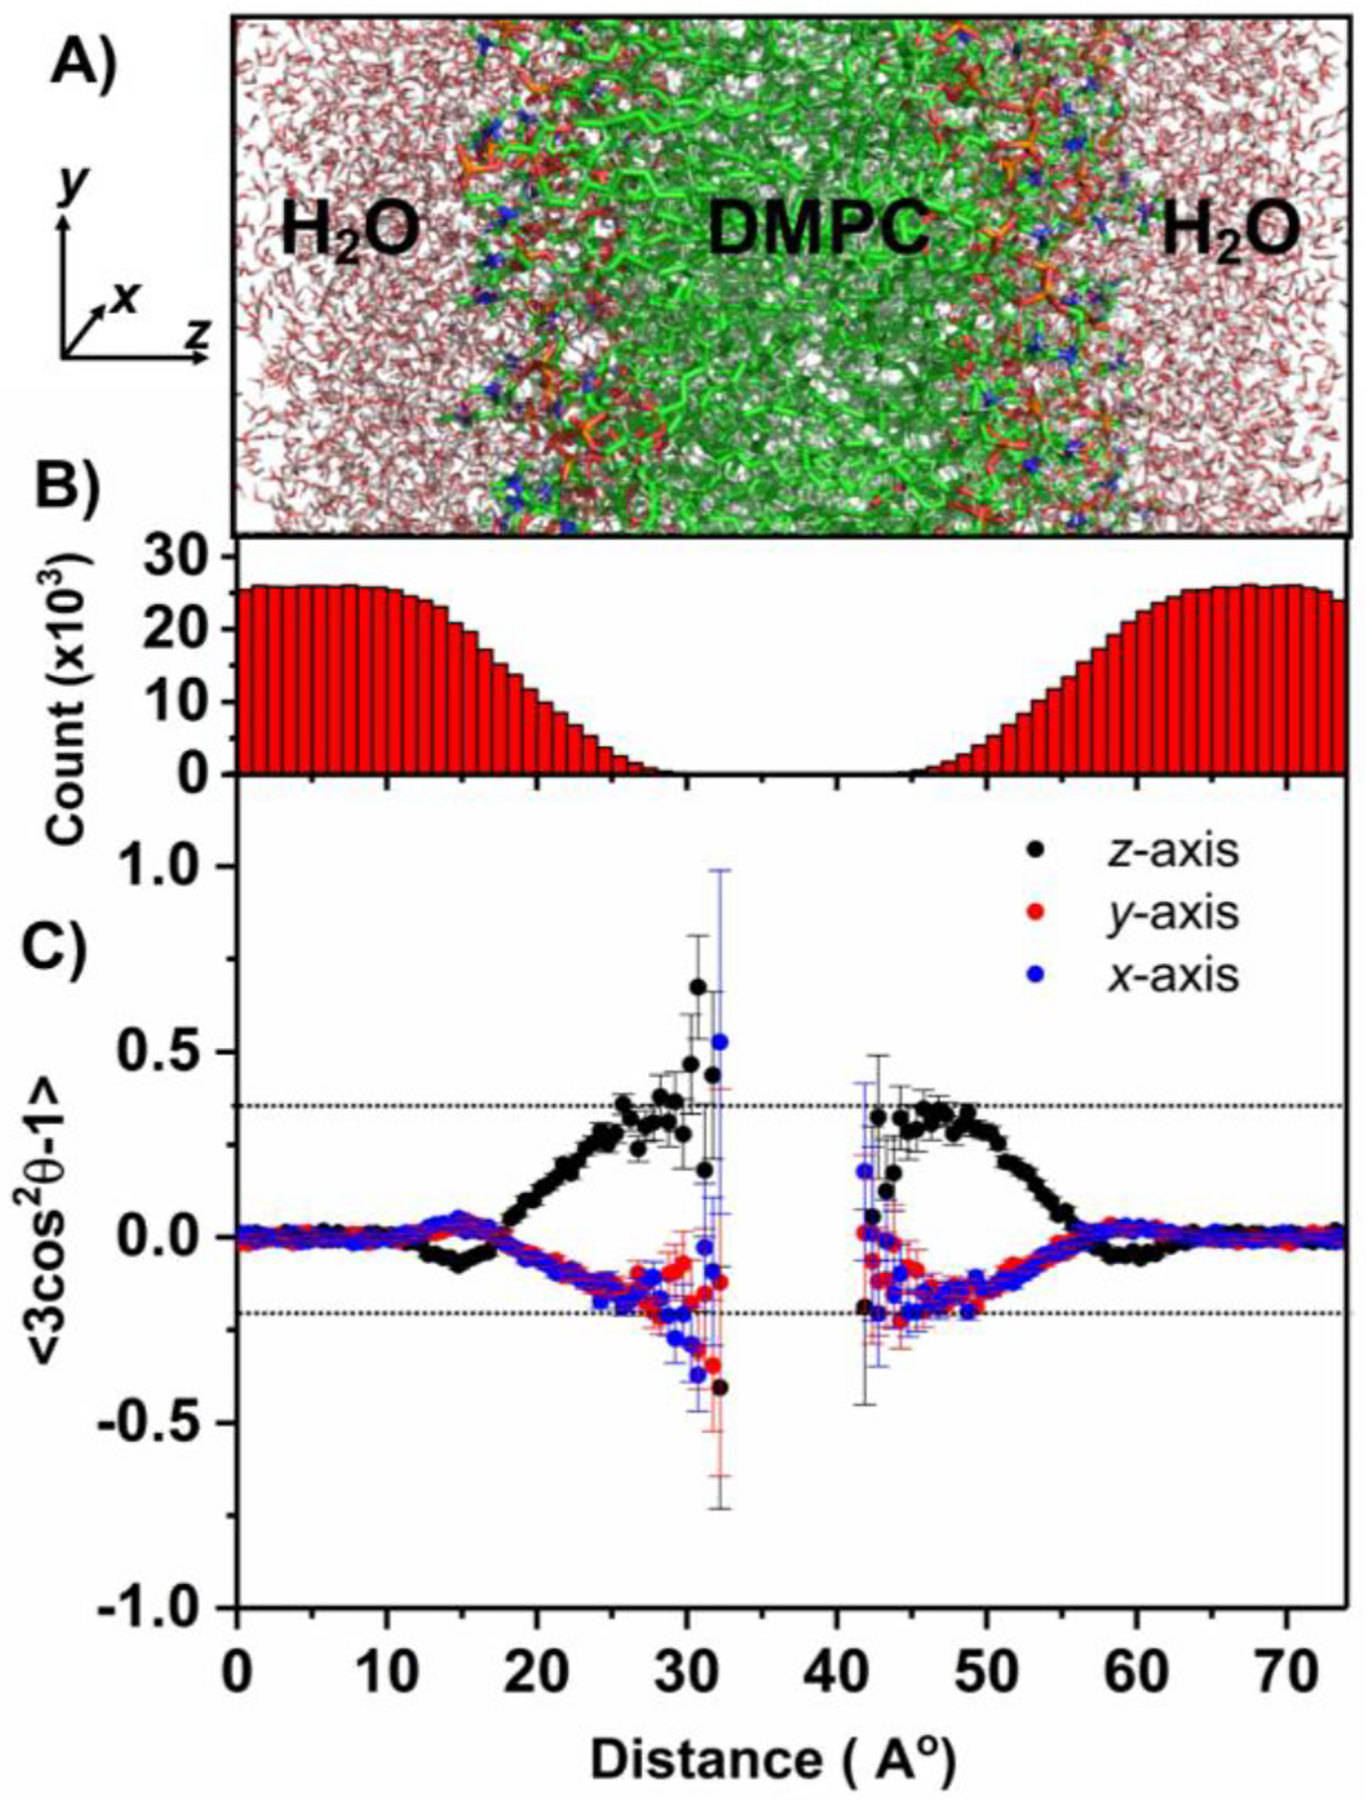
Figure 4.

(A) Selected region of the DMPC:water system (consisting of 256 DMPC and 10153 water molecules) used in molecular dynamic simulations; additional details can be found in the supporting information (Figs.S4 and S5). (x, y, z) coordinates are shown with the z-axis parallel to the lipid bilayer normal. (B) Total number of water molecules present in the xy plane plotted along the z-coordinate (i.e. lipid-bilayer normal) throughout the simulation time. (C) Space and time-averaged <3Cos2θ−1> as a function of the z-coordinate; where θ is the angle between the normal to the water plane (i.e. the main principal axis of 17O quadrupole coupling tensor) and x (blue), y (red), and z (black) axes. Space averaging was done for all water molecules present in the xy plane for each point along the z-axis. The error bar represents the slandered deviation from the average value. The large error bars are due to less water molecules present in the core of the bilayer. See the supporting information for additional details on the simulations used in this study.
