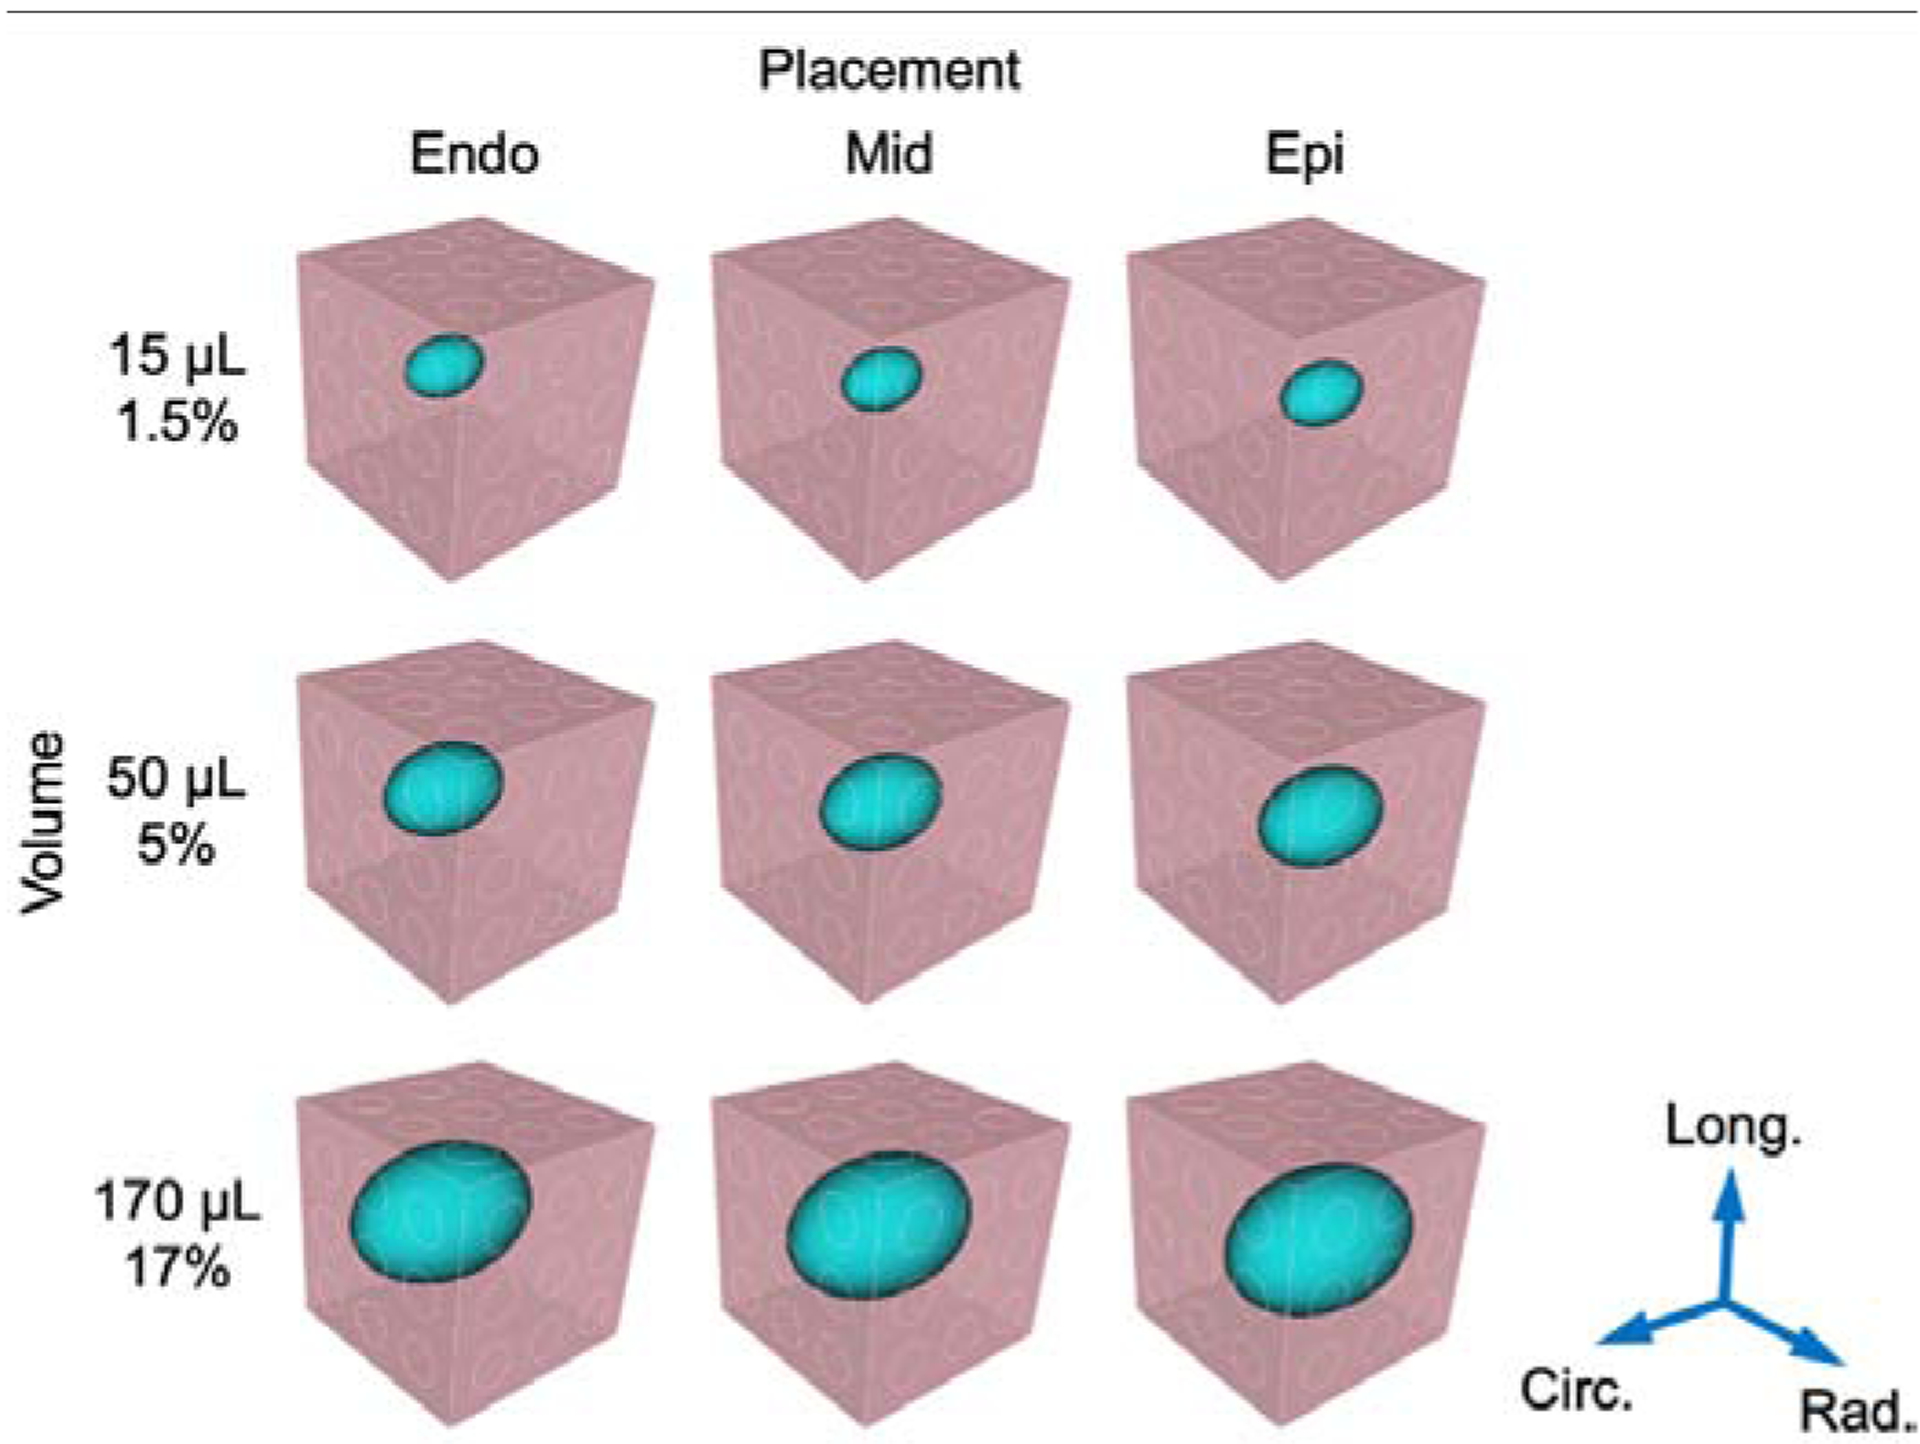
Fig. 3: Model geometries used in the simulation study.

Injection (blue) placement was varied along the radial direction at endocardial (endo), midwall (mid), and epicardial (epi) locations within the myocardium cuboid (pink). Injection volume ranged 1.5%–17% of the total region volume. A separate FE mesh was constructed for each combination of the hydrogel characteristics.
