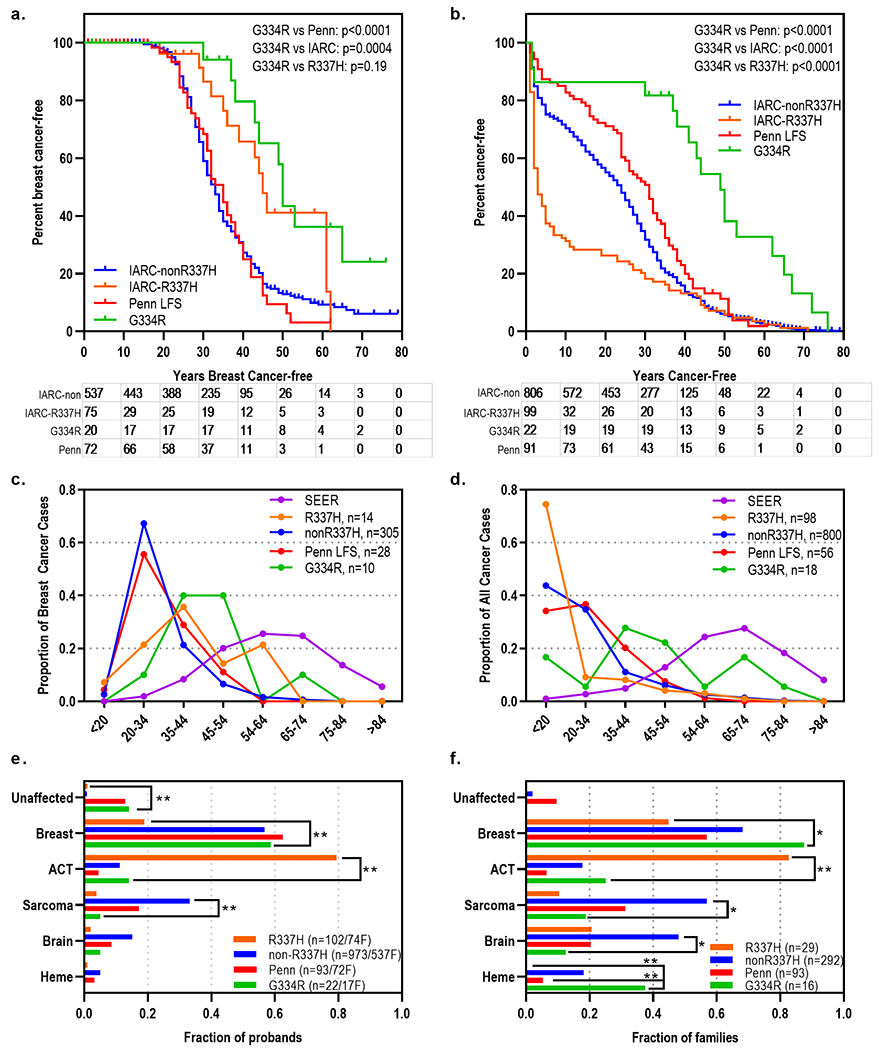
Fig. 4: Age of cancer onset and cancer spectrum in probands and families with TP53 c.1000G>C;p.G334R.

(a) Kaplan-Meier curves showing fraction of probands without a breast cancer diagnosis from families with TP53 c.1000G>C;p.G334R compared to an institutional LFS cohort and the IARC dataset, split into carriers and non-carriers of p.R337H. (b) Kaplan-Meier curves showing fraction of probands without any cancer diagnosis from families with TP53 c.1000C>G;p.G334R compared to an institutional LFS cohort and the IARC dataset, split into carriers and non-carriers of p.R337H. (c) Proportion of probands with age of onset of breast cancer in the indicated deciles from TP53 c.1000G>C;p.G334R families compared to an institutional LFS cohort, the IARC dataset split into carriers and non-carriers of p.R337H, and national SEER data. (d) Proportion of probands with age of onset of any cancer in the indicated deciles from TP53 c.1000G>C;p.G334R families compared to an institutional LFS cohort, the IARC dataset split into carriers and non-carriers of p.R337H, and national SEER data. (e) Fraction of probands with the indicated LFS-component cancers from TP53 c.1000G>C;p.G334R families compared to an institutional LFS cohort and the IARC dataset, split into carriers and non-carriers of p.R337H. (f) Fraction of families with at least one family member with the indicated LFS-component cancers from TP53 c.1000G>C;p.G334R families compared to an institutional LFS cohort and the IARC dataset, split into carriers and non-carriers of p.R337H. *p<0.01; **p<0.003 (Bonferroni corrected).
