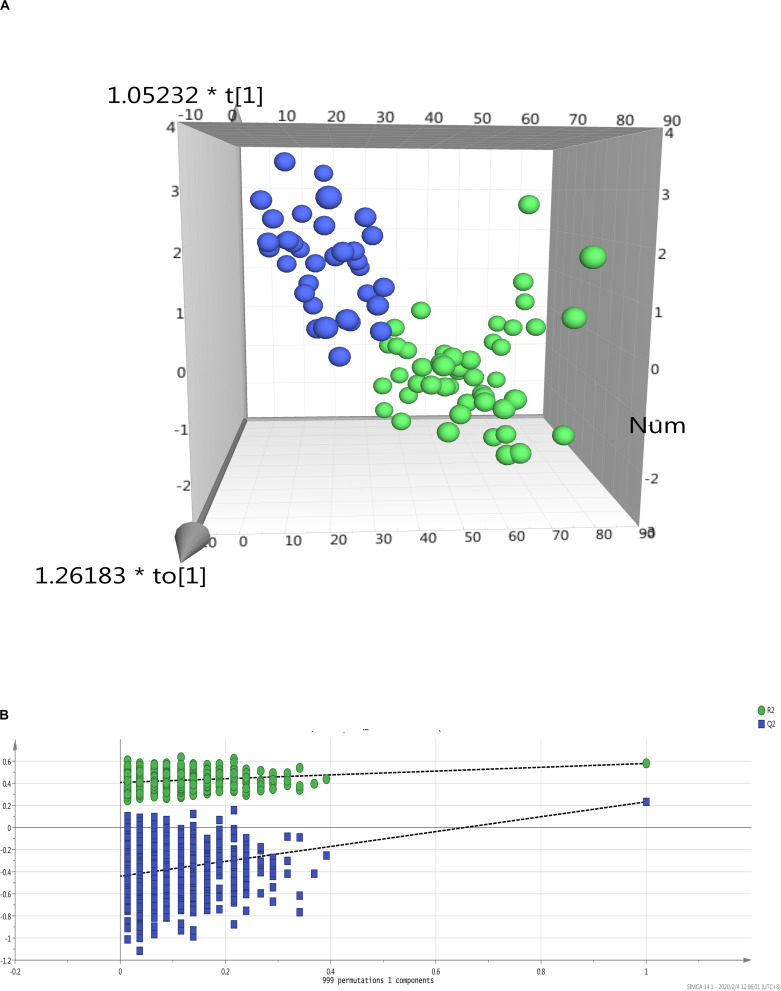
FIGURE 2.
Multivariate data analysis on metabolic profiles of donor livers by MaS status. (A) PCA analysis revealled clear separation on patients received MaS (blue dots) and non-MaS (green dots) allografts by OPLS-DA model; (B) Validation of OPLS-DA model by class permutation analysis for panel (A). MaS, macrosteatosis, OPLS-DA, orthogonal projection to latent structures discriminant analysis; PCA, principal component analysis.

