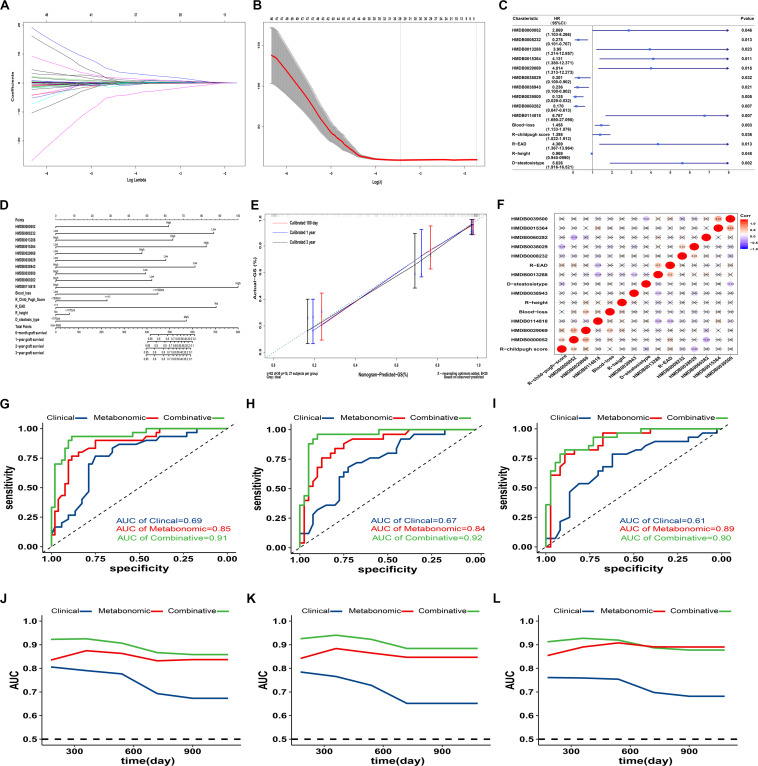
FIGURE 4.
Predictive effects of clinical-metabonomic model on post-transplant prognosis. (A). Lasso coefficient profiles of selected factors in univariate analysis; (B) Optimal parameter selection in LASSO model by cross-validation via minimum criteria. Partial likelihood deviance curve was plotted versus log(λ). Dotted vertical lines were drawn at the center of optimal values using the minimum criteria within one SE of the minimum criteria. (C) Forest plot of potential candidates with construction for predictive model on GF occurrence by cox proportional analysis; (D) Nomogram for GF prediction based on candidate clinical and metabonomic factors; (E) Calibration curves for association between predicted and actual GF in different time points. (F) Heatmap with pairwise correlation analysis across potential clinical and metabonomic covariates; (E) Performance of different models (clinical, metabonomic and combinative) on GF prediction in all LT cases; (F) Performance of different models (clinical, metabonomic and combinative) on GF prediction in LT cases from cohort A; (G) Performance of different models (clinical, metabonomic and combinative) on GF prediction in LT cases from cohort B; (H) Time-dependent AUROC values for different models on GF prediction in all LT cases; (I) Time-dependent AUROC values for different models on GF prediction in LT cases from cohort A; (J) Time-dependent AUROC values for different models on GF prediction in LT cases from cohort B; (K). GF, graft failure; LASSO, least absolute shrinkage and selection operator; LT, liver transplantation; SE, standard error.

