
Figure 1.
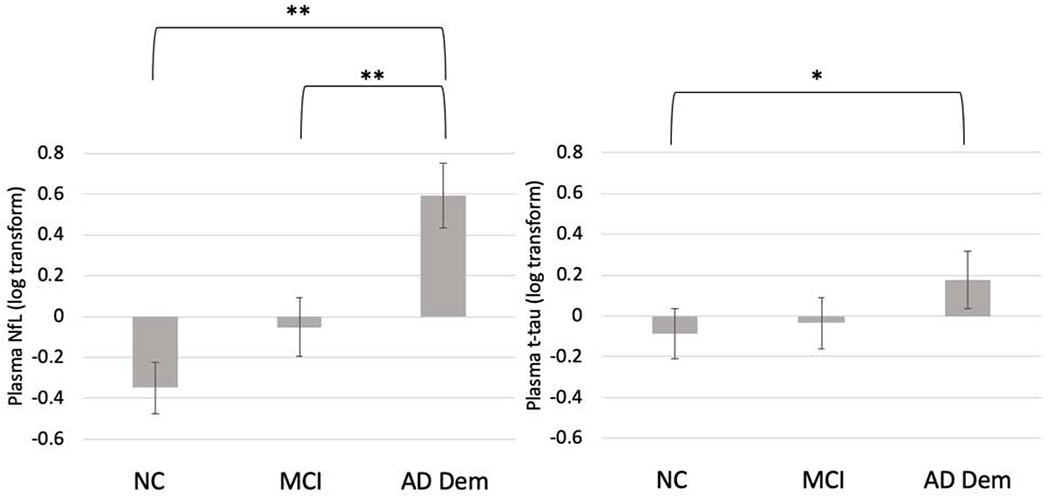
Mean plasma biomarker levels at baseline, separated by consensus diagnostic groups. Error bars represent the 95% confidence intervals. Values are shown as standardized log-transformed scores. *p < .01, *p < .001 based on results from ANCOVA models and post-hoc comparisons (shown in Table 2) accounting for demographic covariates and APOE ε4 carrier status.