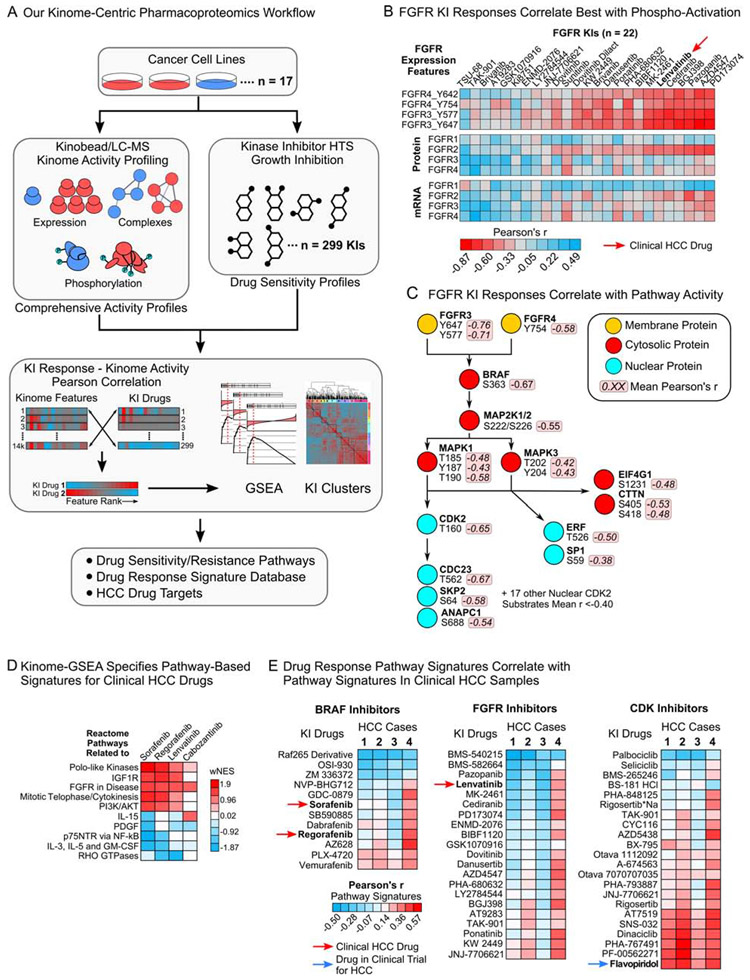
Figure 1. A pharmacoproteomics platform linking kinome features to drug response.
(A) Schematic of our kinome-centric pharmacoproteomics platform.
(B) Pearson’s r-values for FGFR1-4 expression features correlated with the AUCs of all 22 FGFR KIs in our drug screen.
(C) Phosphosites in the FGFR-RAF/MEK/ERK-cell cycle signaling cascade correlated with responses to the seven FGFR KIs that showed the strongest correlation with FGFR3 and FGFR4 tyrosine phosphorylation (see (B)).
(D) Examples for pathways that are associated with sensitivity (positive wNES) or resistance (negative wNES) to clinical HCC drugs. wNES is the FDR-weighted normalized Reactome pathway enrichment score.
(E) Correlation of pathway-based drug response signatures defined in 17 HCC lines with kinome pathway signatures identified in clinical HCC samples, showing that response signatures for specific KI drugs are enriched in human tumors (see Table S5).

