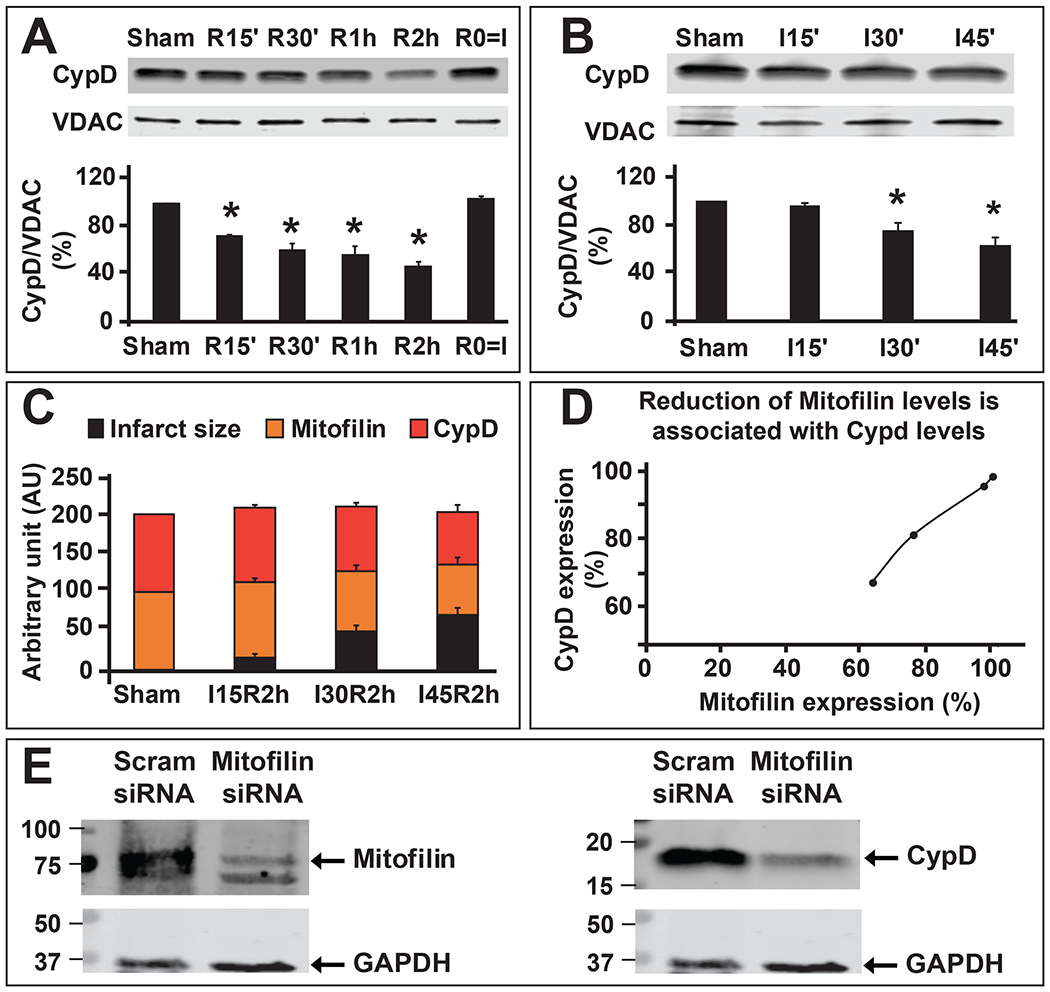
Figure 2. Reduction in CypD expression is associated with decreased Mitofilin levels and an increase in myocardial infarct size.

A. Representative immunoblots and graph (mean of 4 independent experiments) showing reduction of CypD levels after the durations of reperfusion for 0 (R0=I, ischemia only), 15, 30, 60, 120 min) 45 min of ischemia, compared to sham (non-ischemic). Values are expressed as mean±SEM; *P<0.05 versus. control group, (n= 4 hearts/group). B. Representative immunoblot and graph (mean of 4 independent experiments) showing reduction of CypD levels with an increase in ischemic duration (15, 30, and 45 min), compared to sham (non-ischemic) followed by the same time of reperfusion (10 min). Values are expressed as mean±SEM; *P<0.05 versus. control group, (n= 4 hearts/group). C. Graph showing the progression of myocardial infarct size (black) in the function of Mitofilin expression (orange) and CypD (red) in sham (non-ischemic) and after different durations of ischemia (15, 30, and 45 min) followed by two-hour reperfusion. Note that an increase in myocardial infarct size is inversely proportional to Mitofilin and CypD expressions after I/R. D. Graph showing the corresponding levels of Mitofilin and CypD levels. Note that a decrease in Mitofilin expression after I/R is proportional to the decrease in CypD levels suggesting a link in the regulation between both proteins during reperfusion. E. Immunoblots showing that reduction of Mitofilin levels (left) in H9c2 rats myoblasts transfected with Mitofilin siRNA is associated with a decrease in CypD levels (right).
