
Fig. 7.
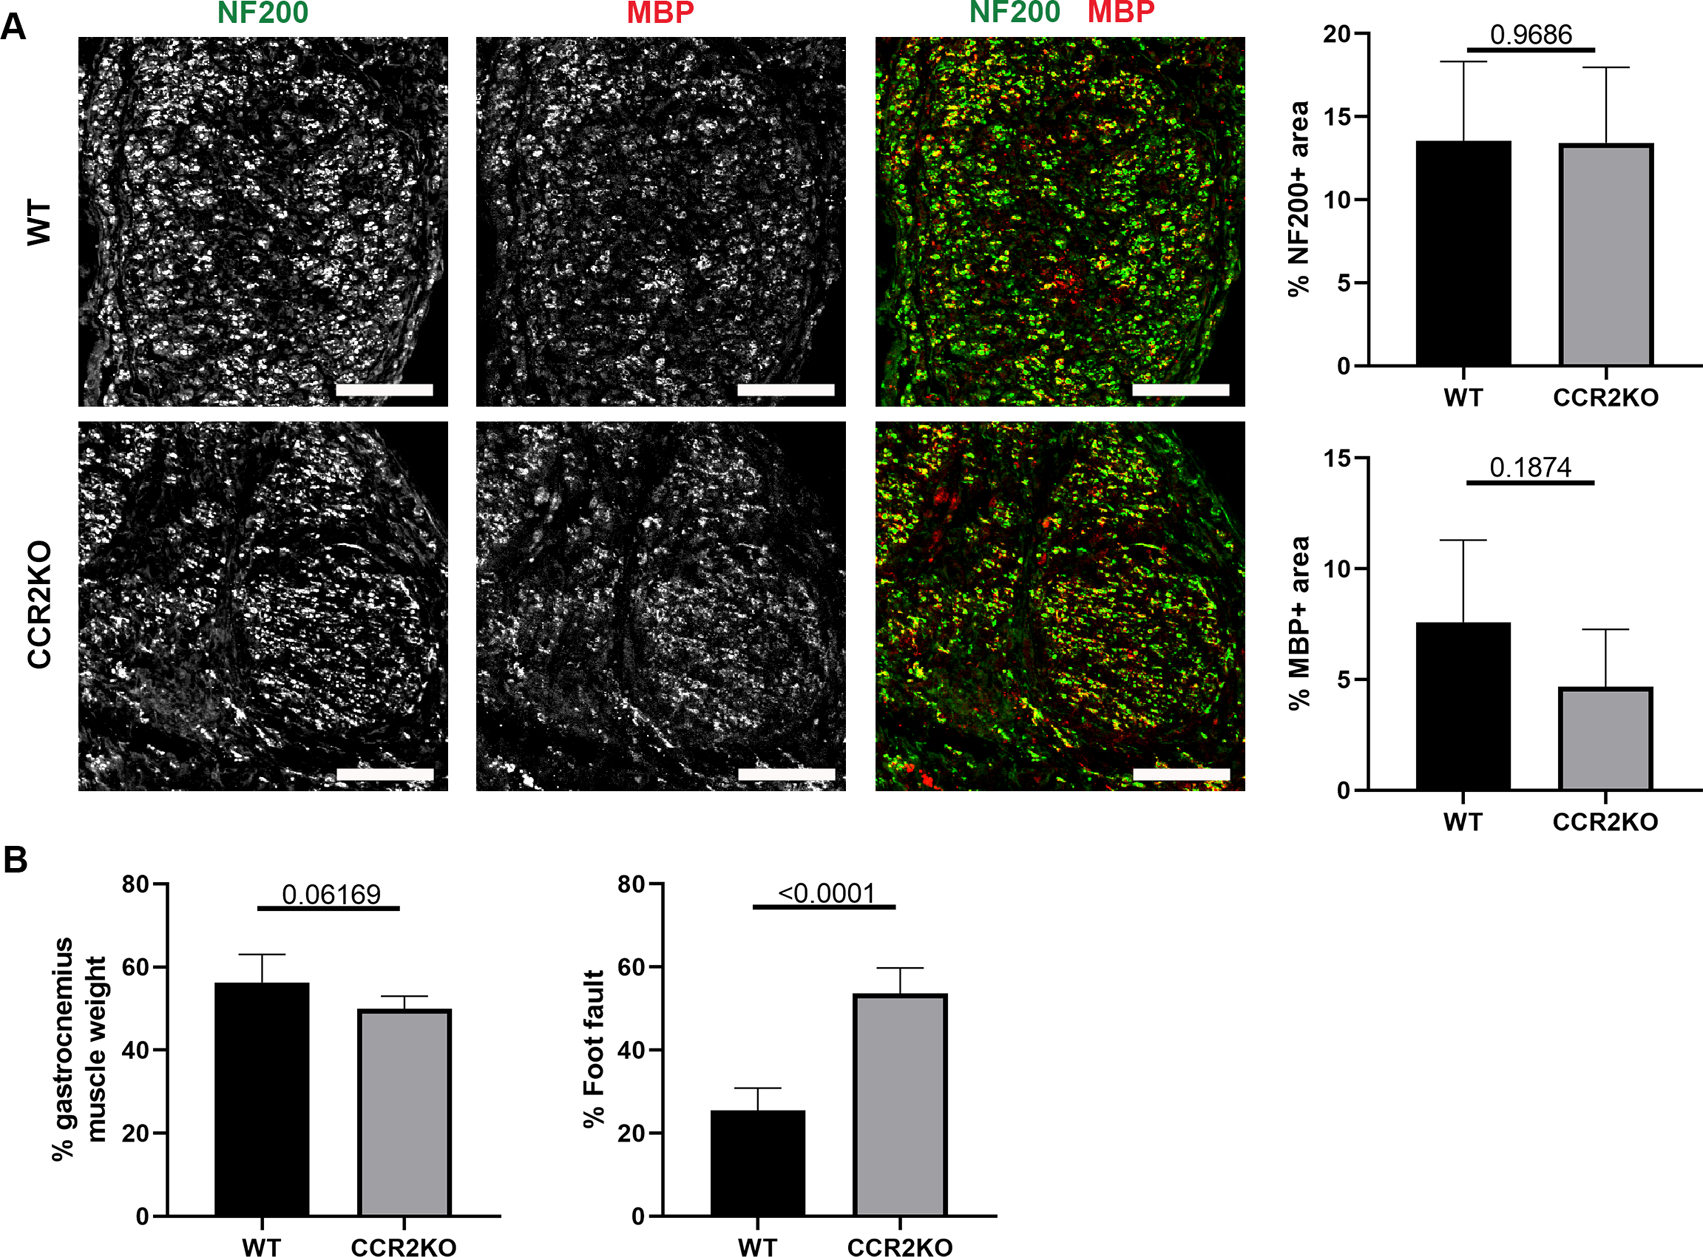
CCR2 deficiency impairs functional recovery across ANAs. A) Representative immunofluorescence staining and quantification of axons and myelin (MBP) within ANAs 6 weeks post-repair from CCR2 KO and WT mice. Cross-sections of nerve are presented. Scale bars represent 50 μm. B) Relative gastrocnemius muscle mass and grid-walk analysis at 6 weeks post-repair from CCR2 KO and WT mice. Mean ± SD, n=5/group; p values shown.