Abstract
Immunotherapies targeting programmed cell death protein 1 (PD-1) and its ligand PD-L1 as well as cytotoxic T-lymphocyte-associated protein 4 (CTLA4) have shown impressive clinical outcomes for multiple tumours. However, only a subset of patients achieves durable responses, suggesting incompletely understood mechanisms of the immune checkpoint pathways. Here, we report that PD-L1 translocates from the plasma membrane into the nucleus through interaction with components of endocytosis and nucleocytoplasmic transport pathways, which is regulated by p300-mediated acetylation and HDAC2-dependent deacetylation of PD-L1. Moreover, PD-L1 deficiency leads to compromised expression of multiple immune response-related genes. Genetically or pharmacologically modulating PD-L1 acetylation blocks its nuclear translocation, reprograms the expression of immune response-related genes and consequently enhances the anti-tumour response to PD-1 blockade. Thus, our results reveal an acetylation-dependent regulation of PD-L1 nuclear localization that governs immune response gene expression, thereby advocating for targeting PD-L1 translocation to enhance the efficacy of PD-1/PD-L1 blockade.
Evasion of immune surveillance is one of the most essential features of tumourigenesis1. To evade the immune response, activation of two crucial negative regulatory checkpoint pathways, CTLA4 and PD-L1/PD1, is frequently observed in tumour microenvironment2. Indeed, antibodies against these molecules have exhibited improved clinical outcomes in a variety of human cancers3. However, the response rate is relatively low (15~25%) for several cancer types, and only a subset of patients achieves durable responses4. Notably, almost one third of primary responders will relapse over time5, suggesting the incompletely understood mechanisms of the immune checkpoint pathways. Membrane-anchored PD-L1 has been well-studied for its engagement with PD-1 on T cells to evade anti-tumour immunity2. Expression of PD-L1 is tightly controlled at transcriptional and post-translational levels, however, aberrant expression of PD-L1 is observed in human cancers6–8. Importantly, high expression of PD-L1 in tumours has been suggested to be one of the biomarkers for improved sensitivity to PD-1/PD-L1 blockade9,10. However, the underlying mechanisms of how increased expression of PD-L1 sensitizes the efficiency of PD-1 blockade remains unclear.
Lysine acetylation of non-histone proteins can compete with ubiquitination to affect protein stability or subcellular localization11, 12. Notably, acetylation of epidermal growth factor receptor (EGFR), which is mainly expressed on the plasma membrane, by adenosine 3, 5-monophosphate (cAMP) response element binding protein (CBP) regulates its Clathrin-mediated endocytosis and nuclear localization13–15. PD-L1 is also a plasma membrane protein and undergoes ubiquitination by several ubiquitin E3 ligases6, 7, 16, 17, and acetylation of PD-L1 has been suggested18, however, the regulatory mechanisms and functional effects of the acetylation remain largely unknown.
Here, we report that PD-L1 is acetylated on K263 residue in the cytoplasmic domain by p300 acetyltransferase, and deacetylation of PD-L1 by HDAC2 triggers nuclear translocation via interaction with multiple proteins involved in endocytosis and nuclear import. Moreover, nuclear PD-L1 binds to DNA and regulates expression of multiple immune response-related genes to modulate the anti-tumor immune response. Thus, our findings reveal an acetylation-dependent PD-L1 nuclear localization regulation and suggest a strategy for improving the efficacy of PD-1/PD-L1 blockade by targeting PD-L1 translocation.
Results
PD-L1 is acetylated at K263 within its cytoplasmic domain by p300
We observed that acetylation of endogenous PD-L1 was detected by a pan-acetyl lysine antibody in multiple cell lines (Fig. 1a; Extended Data Fig. 1a, b). Next, we found that ectopic expression of p300 and CBP, but not other acetyltransferases including GCN5, PCAF or Tip60, promoted acetylation of PD-L1 (Fig. 1b). However, endogenous acetylation of PD-L1 was reduced by treatment with a selective p300/CBP inhibitor A48519 or knockdown of p300, but not CBP (Fig. 1c–e). Furthermore, p300 directly acetylates of recombinant PD-L1 in vitro (Fig. 1f). These results demonstrate that p300 might represent a physiological acetyltransferase for PD-L1.
Figure 1 |. PD-L1 is acetylated at the lysine 263 residue by p300.
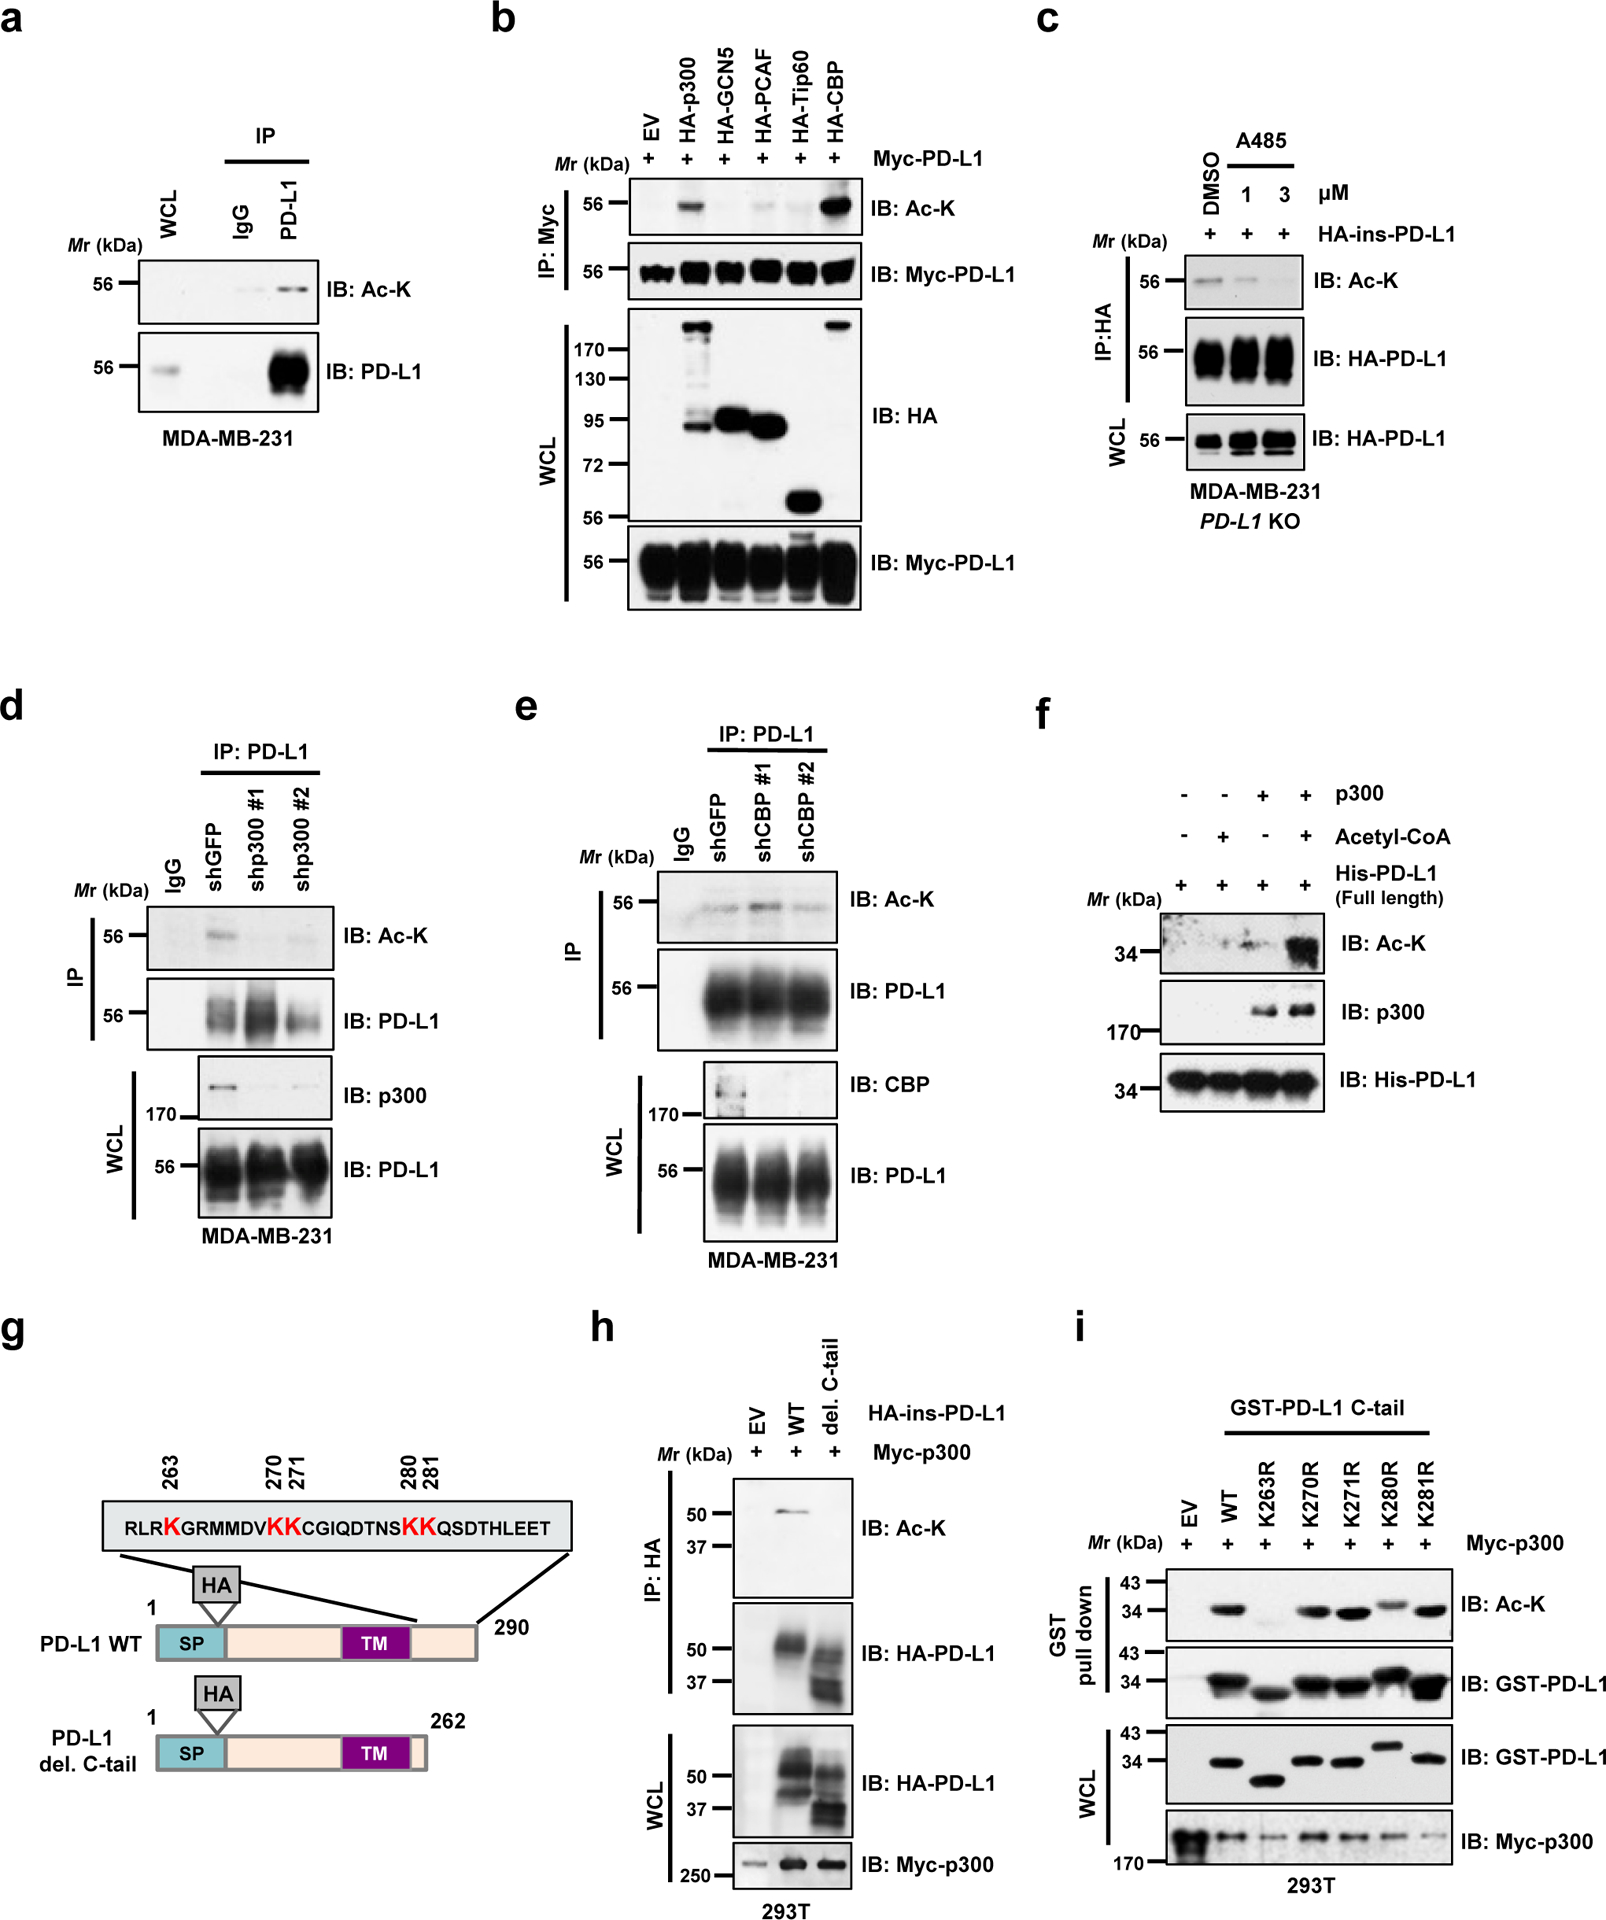
a. Immunoblot (IB) analysis of whole-cell lysates (WCL) and anti-PD-L1 immunoprecipitates (IPs) derived from MDA-MB-231 cells. Immunoglobulin G (IgG) served as a negative control. b. IB analysis of WCL and anti-Myc IPs derived from 293T cells transfected with Myc-PD-L1 and HA-tagged p300, GCN5, PCAF, Tip60 or CBP. c. IB analysis of WCL and anti-HA IPs derived from MDA-MB-231 PD-L1 knockout (KO) cells re-introduced HA-ins-PD-L1 (HA-tag was inserted following the signal peptide) and treated with DMSO or indicated concentration of A485 for 4 hrs. d. IB analysis of WCL and anti-PD-L1 IPs derived from MDA-MB-231 cells transduced with shRNAs against p300 or shGFP as negative control. e. IB analysis of WCL and anti-PD-L1 IPs derived from MDA-MB-231 cells transduced with shRNAs against CBP or shGFP as negative control. f. In vitro acetylation assay using purified His-PD-L1 recombinant protein incubated with p300 in the presence or absence of Acetyl-CoA. g. A schematic illustration of PD-L1 protein domains and amino acid residues in the cytoplasmic domain (C-tail). SP, signal peptide; TM, transmembrane domain. h. IB analysis of WCL and anti-HA IPs derived from 293T cells transfected with Myc-p300 and HA-full length (FL) PD-L1 or the deletion mutant of C-tail (263–290 a.a.). i. IB analysis of WCL and GST pull-down products derived from 293T cells transfected with Myc-p300 and GST-C-tail PD-L1 or KR mutants.
The western blots in a-f, h and i were performed for n=2 independent experiments with similar results. Unprocessed immunoblots are shown in Source Data Fig. 1.
Furthermore, we found that deletion of the cytoplasmic tail (C-tail) of PD-L1 abolished p300-mediated acetylation, suggesting that the acetylation site(s) resides within the C-tail (Fig. 1g,h; Extended Data Fig. 1c,d). To identify the acetylation site(s) on PD-L1, we substituted each of five lysine (K) residues within C-tail into arginine (R) and found that only K263R mutant failed to be acetylated by p300 (Fig. 1i; Extended Data Fig. 1e). In keeping with this result, an antibody raised against acetyl-K263-PD-L1 specifically recognized the acetylated wild type (WT) PD-L1, but not the acetylation-deficient K263R mutant (Extended Data Fig. 1f–h). Using synthetic peptide of PD-L1 amino acids (AA) 261–270, we confirmed the K263 acetylation by p300 by mass-spectrometric (MS) analysis (Extended Data Fig. 1i). These results together indicate that K263 might be the major acetylation site on PD-L1.
HDAC2 specifically interacts with and deacetylates PD-L1
Acetyltransferases and their counteracting deacetylases are important Yin and Yang forces that control various cellular processes20. To identify the potential physiological deacetylase(s) for PD-L1, we treated cells with the deacetylase inhibitors and found that trichostatin A (TSA), an inhibitor of histone deacetylases (HDACs), but not nicotinamide (NIC), a class III Sirtuin deacetylases (SIRTs) inhibitor, increased acetylation of PD-L1 (Fig. 2a). In keeping with this notion, we found that only HDAC2, but not other HDACs or SIRTs, exhibited a physical interaction with PD-L1 (Fig. 2b; Extended Data Fig. 2a). Furthermore, ectopic expression of HDAC2, but not other HDACs, decreased p300-mediated acetylation of PD-L1 (Fig. 2c,d). On the other hand, depletion of endogenous HDAC2 via siRNAs, shRNAs or CRISPR-Cas9 increased acetylation of PD-L1 (Fig. 2e–g). Consistently, a selective HDAC2 inhibitor Santacruzamate A (SCA)21 and a HDAC1/2 inhibitor ACY957, but not a HDAC6 inhibitor ACY1215, increased the acetylation of endogenous PD-L1 (Fig. 2h), supporting the notion that HDAC2 is a bona fide deacetylase for PD-L1. Importantly, we found that HDAC2 inhibitor could elevate PD-L1 acetylation levels in WT, but not in HDAC2 knockout (KO) cells, suggesting the specificity of this compound (Fig. 2i).
Figure 2 |. PD-L1 is deacetylated predominantly by HDAC2.
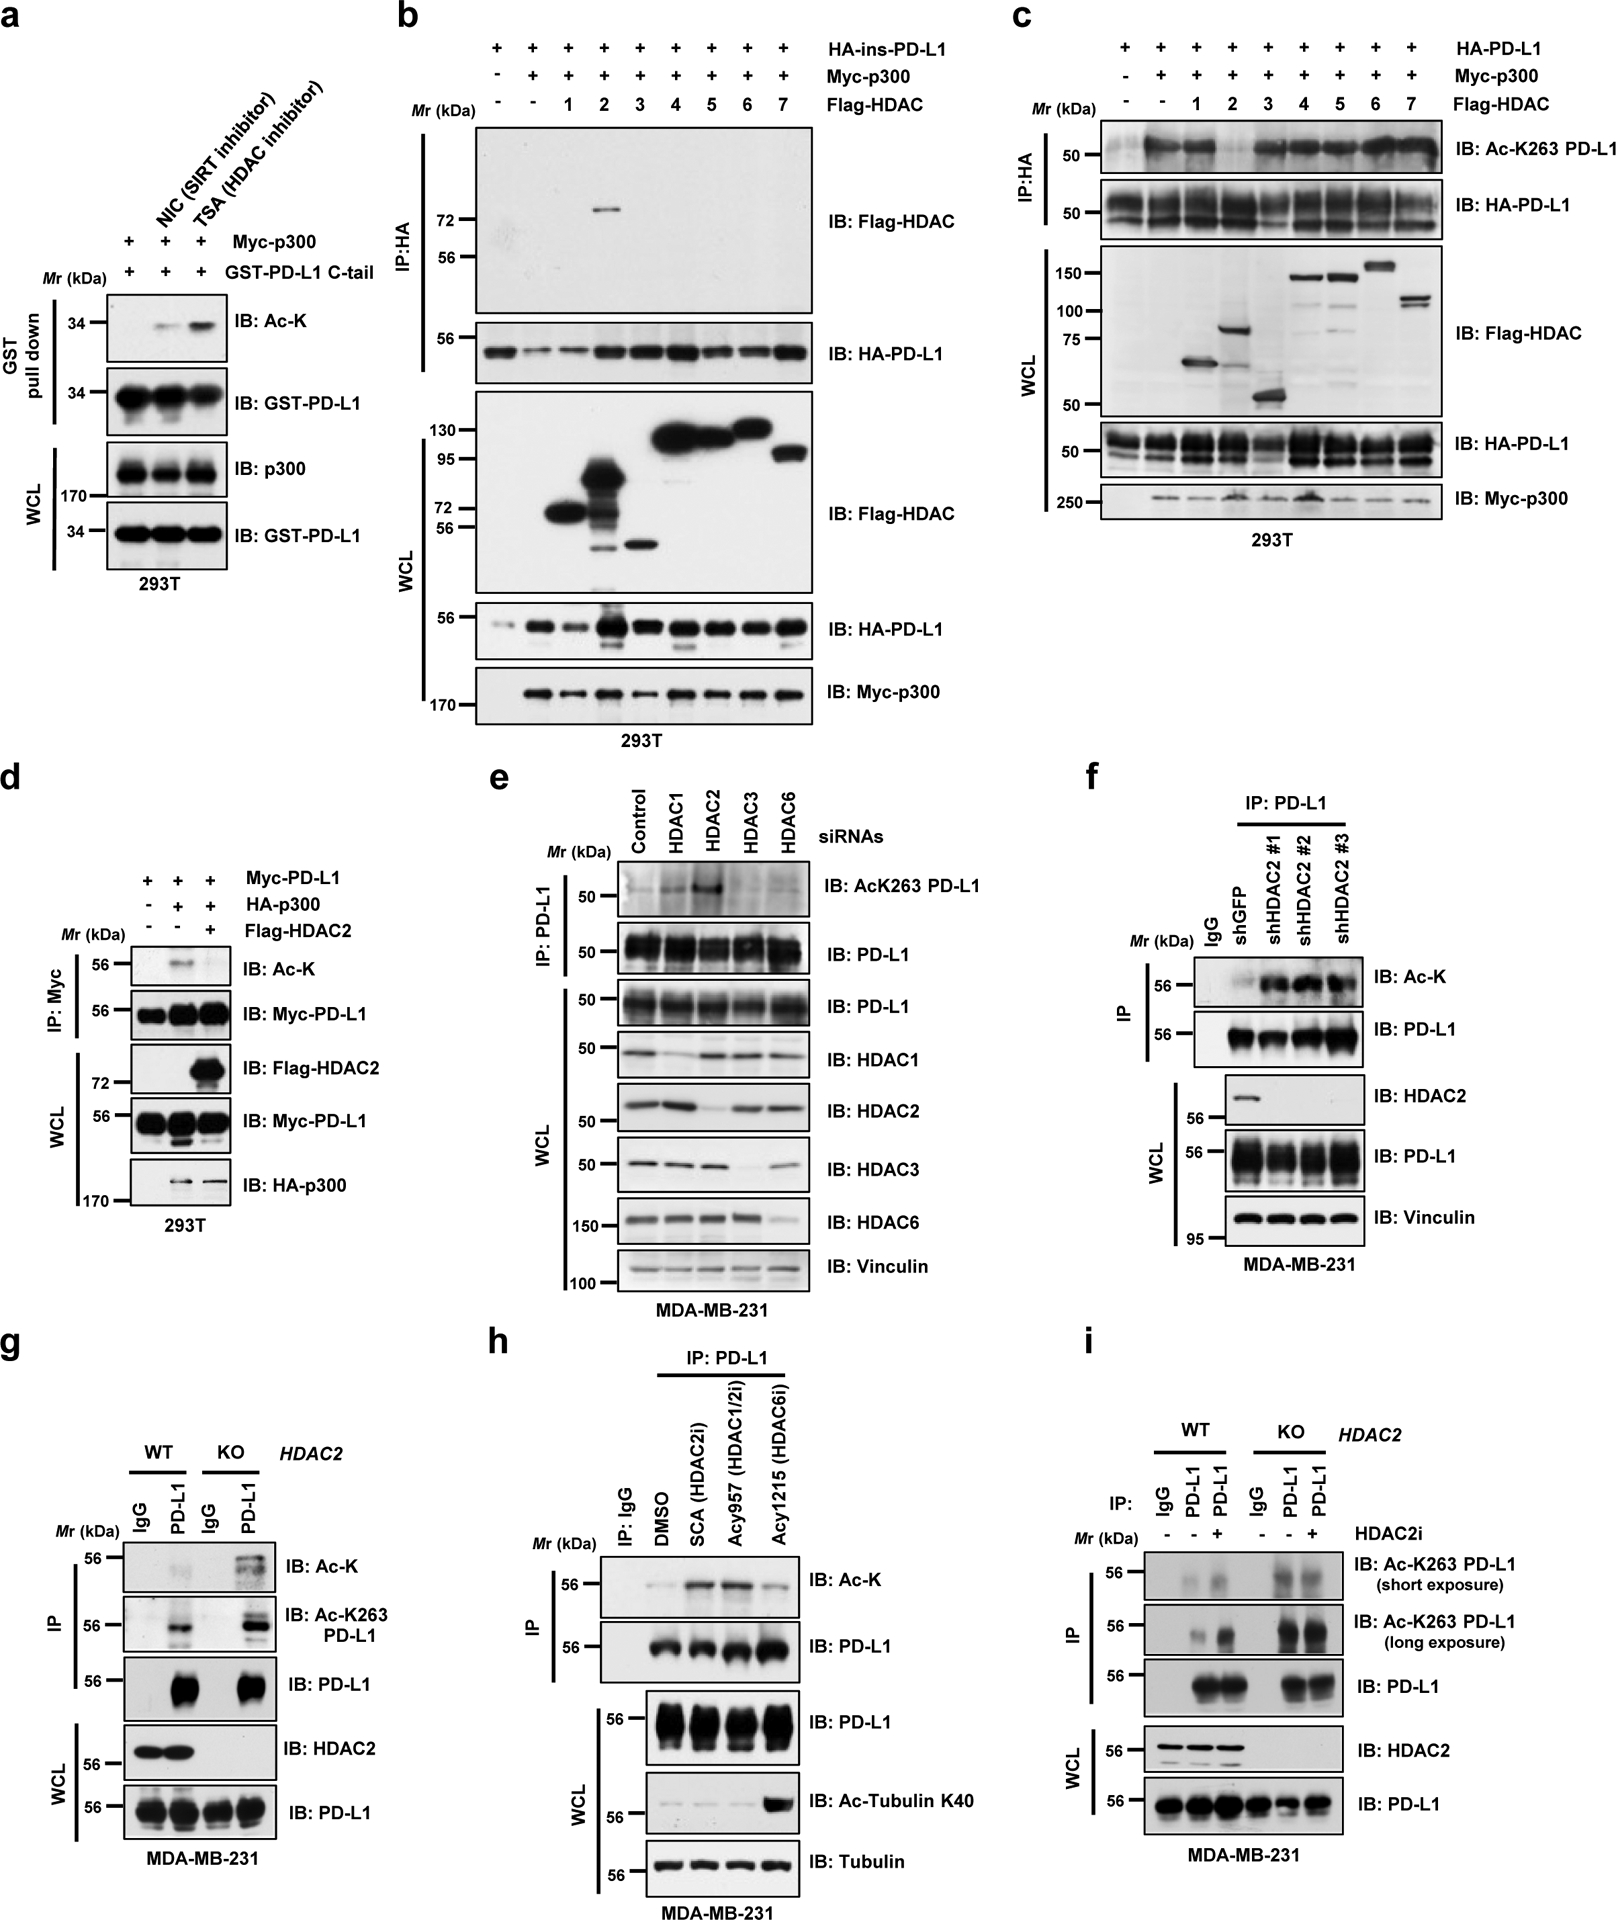
a. IB analysis of WCL and GST pull-down products derived from 293T cells transfected with Myc-p300, GST-PD-L1 C-tail in the presence or absence of the SIRT inhibitor, 5 mM NIA, or the HDAC inhibitor, 1 μM TSA, overnight. b. IB analysis of WCL and anti-HA IPs derived from 293T cells transfected with Myc-p300, HA-ins-PD-L1 and/or indicated Flag-tagged deacetylases. c. IB analysis of WCL and anti-HA IPs derived from 293T cells transfected with indicated constructs to examine PD-L1 acetylation levels. d. IB analysis of WCL and anti-Myc IPs derived from 293T cells transfected with HA-p300, Myc-PD-L1 and/or Flag-HDAC2. e. IB analysis of WCL and anti-PD-L1 IPs derived from MDA-MB-231 cells transfected with control siRNA or siRNAs targeting indicated HDACs. f. IB analysis of WCL and anti-PD-L1 IPs derived from MDA-MB-231 cells transduced with shRNAs against HDAC2 or GFP. g. IB analysis of WCL and anti-PD-L1 IPs derived from MDA-MB-231 wild-type (WT) or HDAC2 KO cells. h. IB analysis of WCL and anti-PD-L1 IPs derived from MDA-MB-231 cells treated with the indicated HDAC inhibitors: Santacruzamate A (SCA), 20 μM; ACY1215, 40 μM; ACY957, 20 μM, for 3 hrs. i. IB analysis of WCL and anti-PD-L1 IPs derived from MDA-MB-231 WT or HDAC2 KO cells, treated with or without 50 μM HDAC2 inhibitor (HDAC2i) for 4 hrs.
The western blots in a-i were performed for n=2 independent experiments with similar results. Unprocessed immunoblots are shown in Source Data Fig. 2.
K263 acetylation affects translocation of PD-L1 into the nucleus
Protein acetylation on lysines could antagonize ubiquitination on lysine residues to affect protein stability, dimerization or subcellular localization11, 12. However, HDAC2 deficiency minimally affected the PD-L1 poly-ubiquitination (Extended Data Fig. 2b). Moreover, there were no detectable changes in protein half-lives or dimerization among WT, acetylation-deficient K263R and acetylation-mimetic K263Q mutant (Extended Data Fig. 2c–e). Strikingly, cellular fractionation assays using two commercial kits and the immunofluorescence analysis of endogenous PD-L1 revealed that, in addition to the expected membrane localized species of PD-L1, a significant portion of PD-L1 was also detected in the nucleus and cytoskeleton in human and mouse cancer cell lines using different commercial PD-L1 antibodies (Fig. 3a,b; Extended Data Fig. 3a–f). We further demonstrated that this finding was also observed in normal non-transformed cells, such as macrophages and mouse embryonic fibroblasts (MEFs) (Extended Data Fig. 3g,h).
Figure 3 |. Nuclear translocation of PD-L1 is regulated by K263 acetylation.
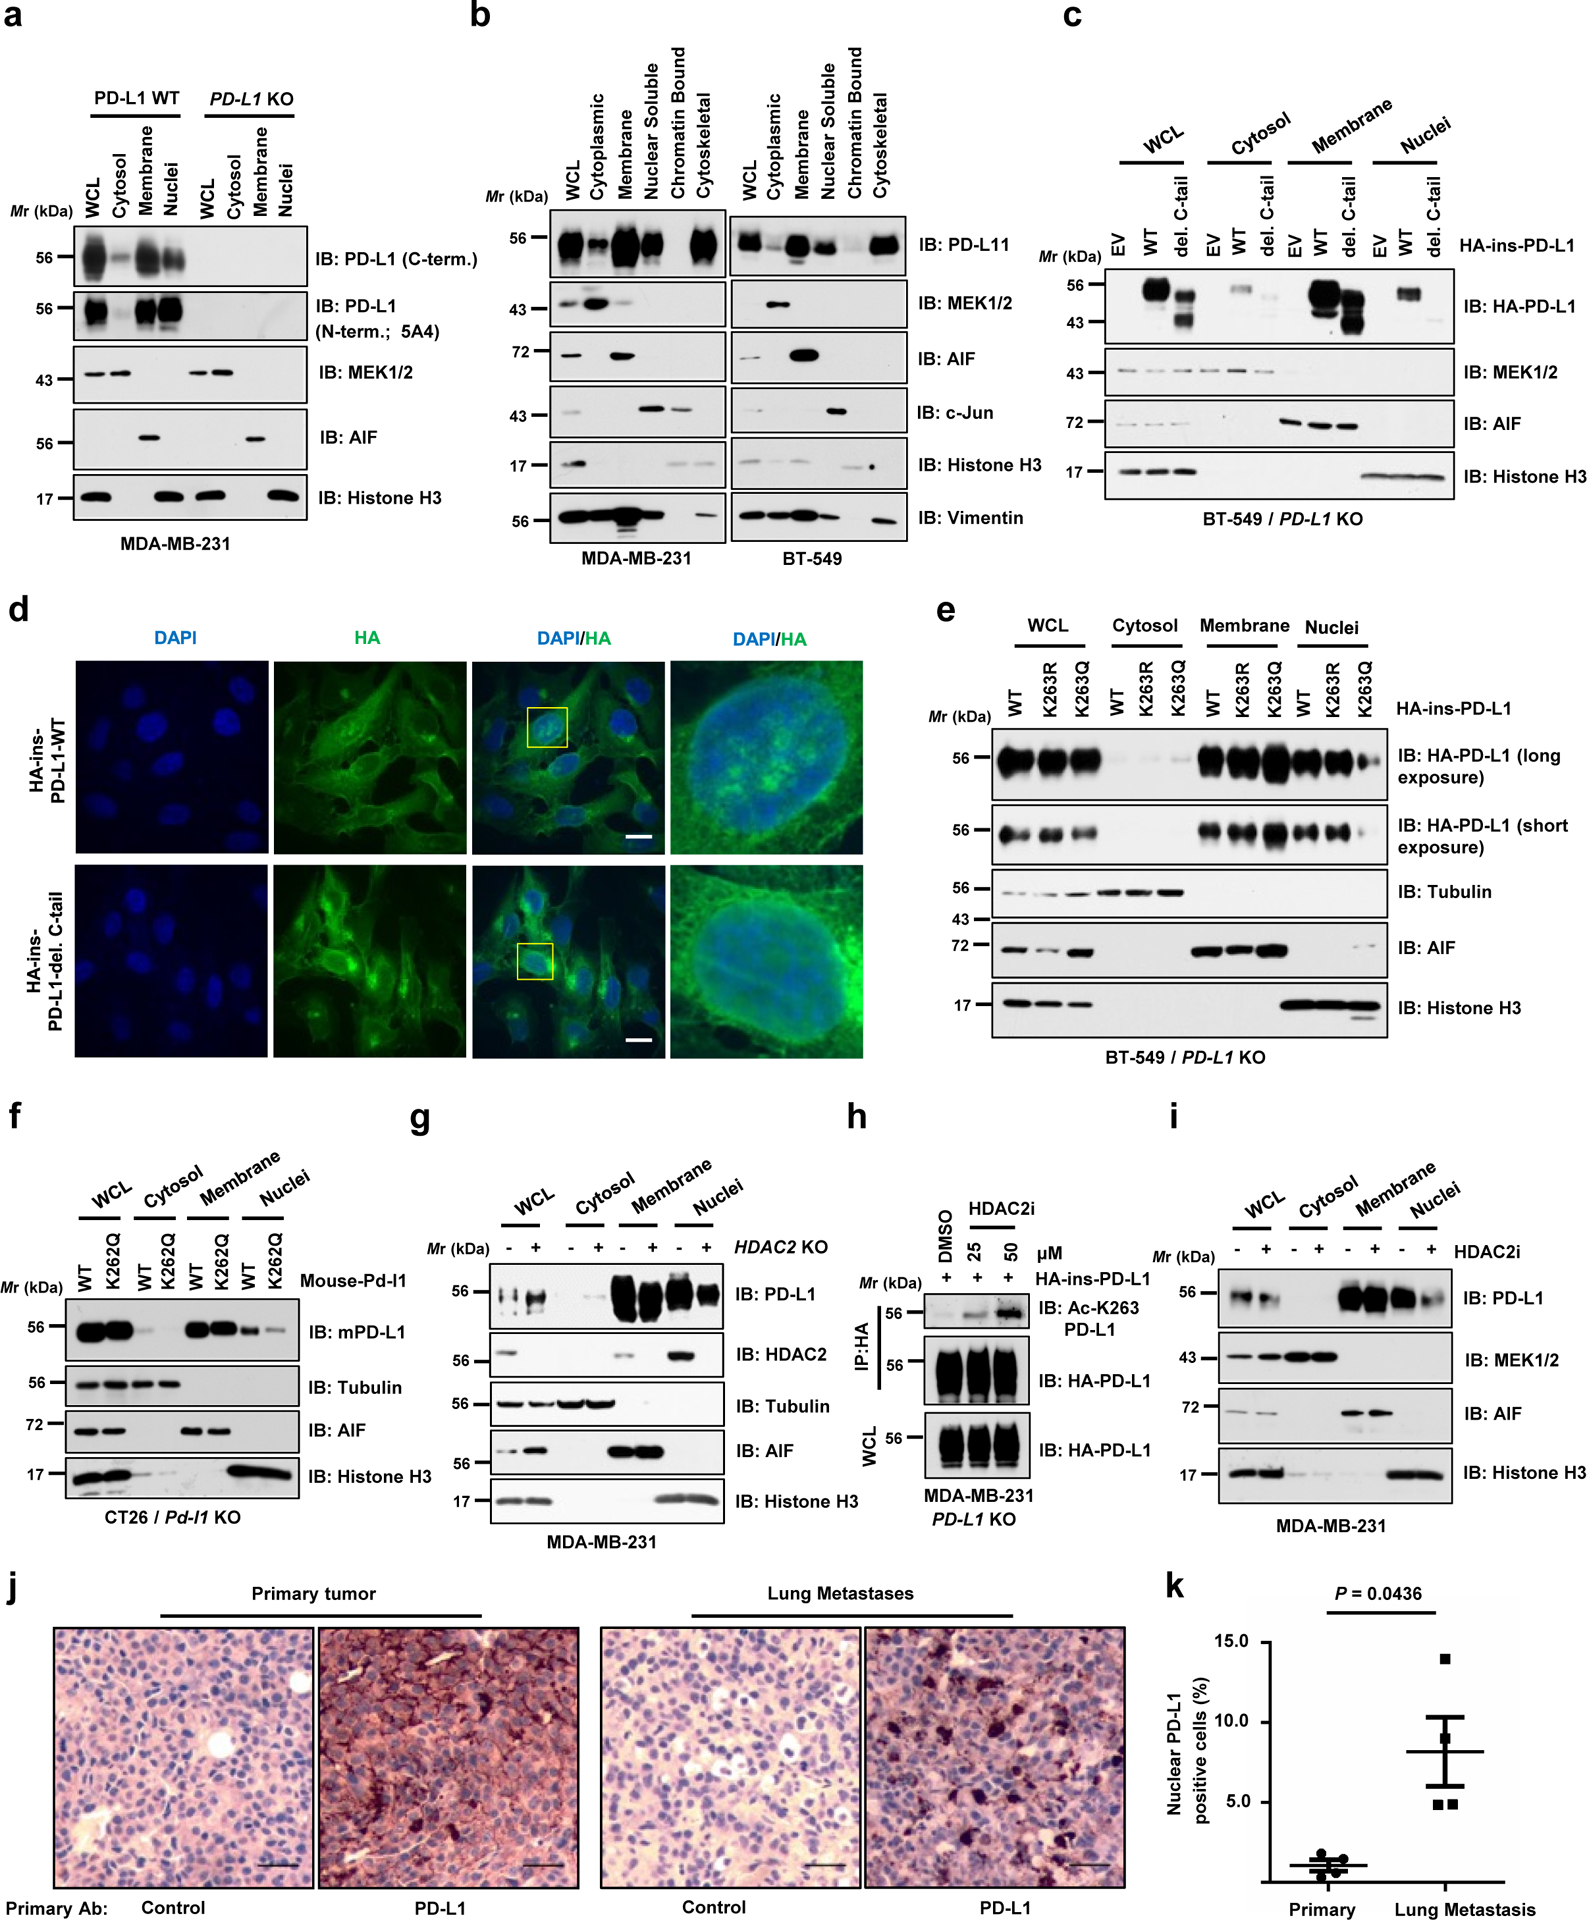
a. IB analysis of WCL, cytosol, membrane, and nuclear fractions derived from MDA-MB-231 WT or PD-L1 KO cells, purified using a Cell Signaling Technology kit. b. IB analysis of WCL, cytoplasmic, membrane, nuclear soluble, chromatin bound and cytoskeletal fractions derived from MDA-MB-231 and BT-549 cells, purified using a Thermo Scientific kit. c. Fractionation analysis for PD-L1 in BT-549 PD-L1 KO cells transfected with HA-ins-PD-L1 WT or C-tail deletion (del. C-tail) mutant. d. Immunofluorescence (IF) with anti-HA antibody and DAPI staining of MDA-MB-231 PD-L1 KO cells transduced with HA-ins-PD-L1 WT or its del. C-tail mutant lentivirus. Scale bars, 10 μm; n=2 independent experiments were performed with similar results. e. Fractionation analysis for PD-L1 in BT-549 PD-L1 KO cells transfected with the indicated constructs. f. Fractionation analysis for WT mouse PD-L1 or K262Q (corresponding to K263Q for human PD-L1) mutant from CT26 Pd-l1 KO cells. g. IB analysis of WCL, cytosol, membrane, and nuclear fractions derived from MDA-MB-231 WT or HDAC2 KO cells. h. IB analysis of WCL and anti-HA IPs derived from MDA-MB-231 PD-L1 KO cells transduced with HA-ins-PD-L1 lentivirus. Resulting cells were treated with DMSO or indicated concentration of the HDAC2 inhibitor (HDAC2i) for 4 hrs. i. Fractionation analysis for PD-L1 in MDA-MB-231 cells treated with 50 μM HDAC2 inhibitor for 6 hrs. j. Immunohistochemistry (IHC) analysis of mouse PD-L1 expression and localization in B16F10 primary tumours (subcutaneous injection) and lung metastases (tail vein injection). Scale bars, 50 μm, 20x magnification. k. Quantification of PD-L1 nuclear positive cell rates in j. Data represent the mean ± s.e.m (n=4 mice). P-value was calculated using two-tailed Student’s t-test with Welch’s correction.
The western blots in a-c and e-i were performed for n=2 independent experiments with similar results. Unprocessed immunoblots are shown in Source Data Fig. 3. Statistical source data are available in Statistical Source Data Fig. 3.
Notably, we found that deletion of the C-tail largely abolished nuclear localization of PD-L1 (Fig. 3c,d; Extended Data Fig. 3i,j). Moreover, the acetylation-mimetic K263Q mutant was compromised in its nuclear localization in both human and mouse cells (Fig. 3e,f; Extended Data Fig. 3k), suggesting that K263 acetylation might block PD-L1 nuclear localization. In addition, nuclear PD-L1 was relatively less acetylated comparing the acetylation status in each fraction (Extended Data Fig. 3l). Moreover, genetic depletion or pharmacologic inhibition of HDAC2 reduced the nuclear portion of PD-L1 (Fig. 3g–i; Extended Data Fig. 3m,n), likely due to elevation of PD-L1 acetylation at K263 (Fig. 2g,3h). Taken together, these findings suggest that acetylation of K263 on PD-L1 plays a critical role in the nuclear translocation process. Interestingly, lung metastases derived from B16F10 cells displayed relatively stronger nuclear PD-L1 expression compared to B16F10-derived subcutaneous primary tumours in which PD-L1 is predominantly expressed on the membrane (Fig. 3j,k), suggesting that nuclear PD-L1 accumulation might facilitate tumour cells to evade the immune surveillance during the metastatic process.
Clathrin-dependent endocytosis of PD-L1 requires interaction with HIP1R
We next examined the molecular mechanisms of how PD-L1 translocates from the plasma membrane to the nucleus. Because the C-tail of PD-L1 lacks a canonical nuclear localization sequence (NLS), we hypothesized that adaptor protein(s) might be required for PD-L1 nuclear translocation. To this end, we identified around 400 proteins as PD-L1 binding molecules by MS approach, and Gene Ontology analysis revealed that these molecules were involved in endocytosis, nuclear transport and export pathways (Fig. 4a,b; Extended Data Fig. 4a; Supplementary Table 1–3). We further investigated the molecular mechanisms underlying PD-L1 nuclear trafficking, and found that Pitstop22, an inhibitor of Clathrin-dependent endocytosis, but not Fillip III23, an inhibitor of Caveolae-mediated endocytosis24, blocked the nuclear localization of PD-L1 (Fig. 4c), suggesting that Clathrin-dependent endocytosis might represent an initial step for the nuclear translocation of PD-L1.
Figure 4 |. PD-L1 interacts with HIP1R to engage Clathrin-dependent endocytosis.
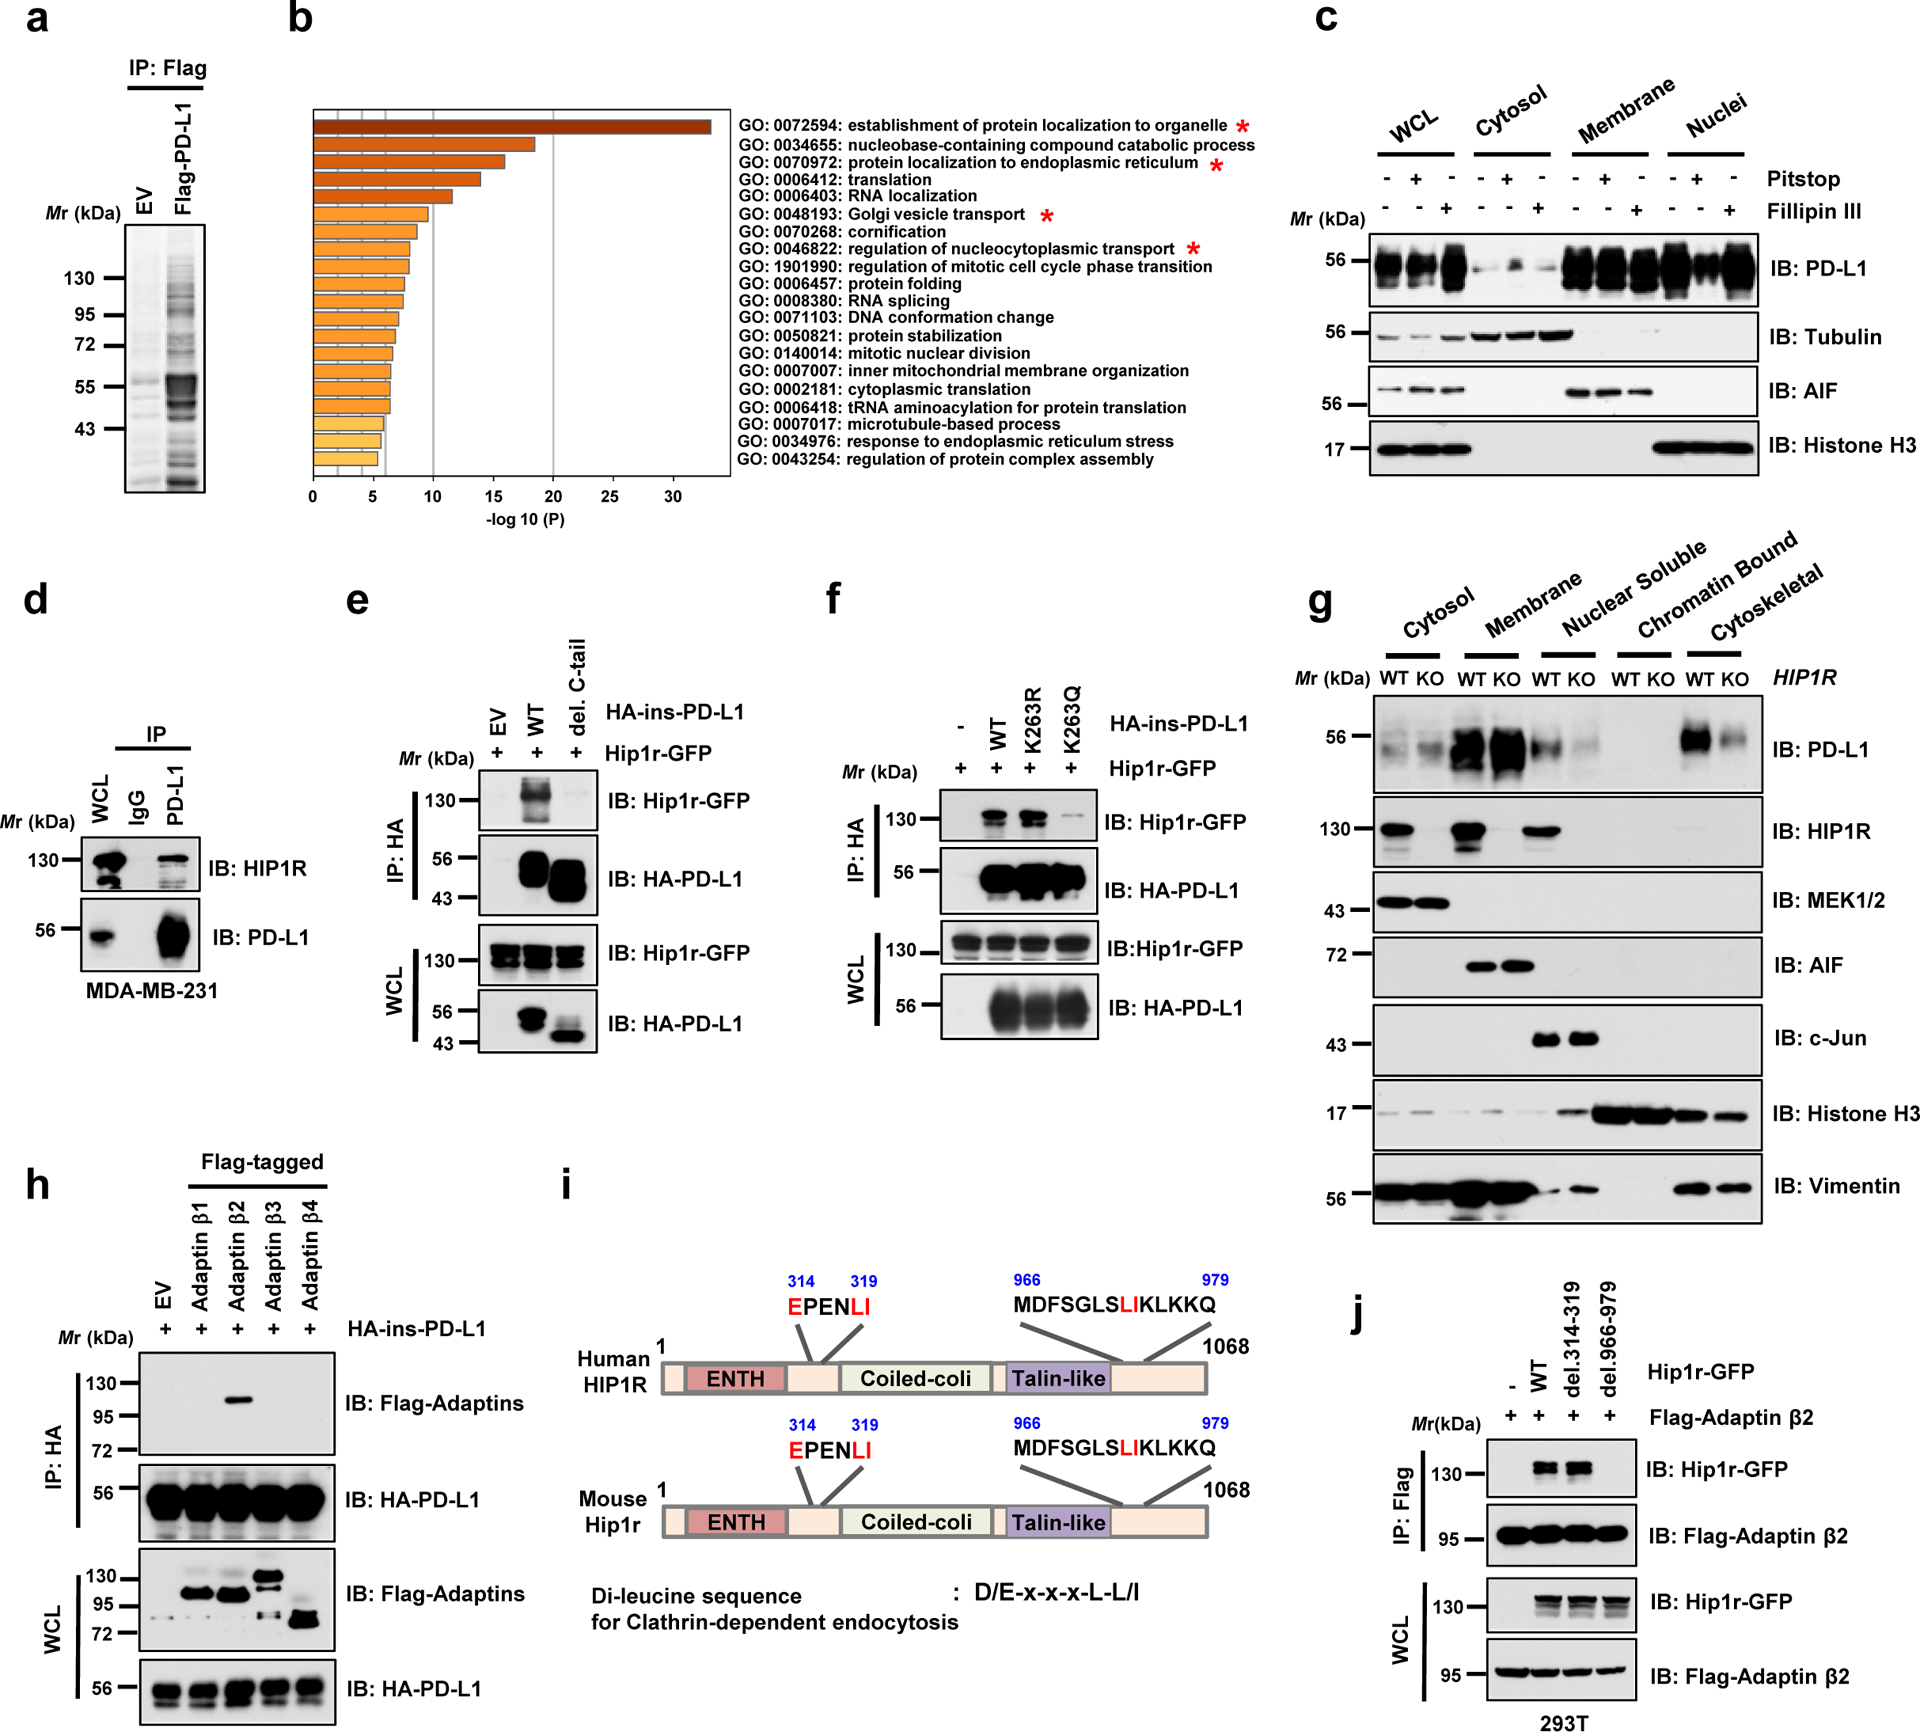
a. Anti-Flag IPs coupled with mass spectrometry analysis to identify PD-L1 interacting proteins in 293T cells, n=2 biologically independent experiments. b. Results from mass spectrometry analysis in a were analyzed for GO term enrichment. Red stars denote pathways associated with protein translocation. n=2 independent experiments with similar results. P values were calculated using hypergeometric test. c. MDA-MB-231 cells were treated with 5 μM Pitstop or 10 μg/ml Fillipin III for 15 min, followed by fractionation analysis. d. IB analysis of WCL and anti-PD-L1 IPs derived from MDA-MB-231 cells. e. IB analysis of WCL and anti-HA IPs derived from 293T cells transfected with mouse Hip1r-GFP and HA-ins-PD-L1 WT or its del. C-tail mutant. f. IB analysis of WCL and anti-HA IPs derived from 293T cells transfected with mouse Hip1r-GFP and HA-ins-PD-L1 WT, K263R or K263Q mutants. g. Fractionation analysis for PD-L1 in MDA-MB-231 WT or HIP1R KO cells. h. IB analysis of WCL and anti-HA IPs derived from 293T cells transfected with HA-ins-PD-L1 and indicated Adaptin constructs. i. Schematic illustration of human and mouse HIP1R protein domains and candidate di-leucine sequences. j. IB of WCL and anti-Flag IPs derived from 293T cells transfected with Flag-tagged Adaptin β2 (AP2B1) and indicated di-leucine sequence deleted constructs.
The western blots in c-h and j were performed for n=2 independent experiments with similar results. Unprocessed immunoblots are shown in Source Data Fig. 4.
Clathrin-dependent endocytosis requires adaptor proteins, which recognize endocytotic sorting sequences in the cytosolic domains of transmembrane proteins25. However, PD-L1 does not harbor the typical endocytotic signal sequences, indicating the involvement of anchoring proteins that link PD-L1 to Clathrin-mediated endocytosis. A recent study showed that huntingtin interacting protein 1-related (HIP1R) protein, which was also identified in our MS analysis (Supplementary Table 3), binds to PD-L1 to promote its lysosomal degradation26. We showed that PD-L1 specifically interacted with HIP1R through its C-tail (Fig. 4d,e). Notably, the acetylation-mimetic K263Q mutant was compromised in its interaction with HIP1R (Fig. 4f), indicating that K263 acetylation might block the binding to HIP1R. In keeping with this result, HDAC2 inhibitor treatment disrupted PD-L1 interaction with HIP1R (Extended Data Fig. 4b). Notably, HIP1R KO cells exhibited a dramatic decrease of nuclear and cytoskeletal localization of PD-L1 compared to WT cells (Fig. 4g). In the process of protein endocytosis, Clathrin selectively binds with cargo adaptors including the adaptor protein (AP) complex27. Our results further showed that Adaptin β2 (AP2B1) interacted with PD-L1 and recognized HIP1R through a di-leucine motif D/E-x-x-x-L-L/I28, AA 966–979 (Fig. 4h–j). Given that PD-L1 is an extensively glycosylated membrane protein16, we next examined whether glycosylation affects PD-L1 acetylation and nuclear translocation. However, we did not observe notable differences in acetylation levels or nuclear localization between WT and the glycosylation-deficient 4NQ mutant PD-L1 (Extended Data Fig. 4c,d), indicating that PD-L1 endocytosis is largely independent of its glycosylation status. Thus, these results suggest a model where HIP1R functions as a bridging protein via the adaptor protein AP2B1 to tether un-acetylated PD-L1 to Clathrin for endocytosis (Extended Data Fig. 4e).
Interaction with Vimentin and Importin 1α facilitates PD-L1 nuclear translocation
Previous reports demonstrated a critical role of the cytoskeleton in nucleocytoplasmic shuttling of proteins such as RelA/p65, EGFR and Yes-associated protein (YAP)29–31. Since our MS analyses showed that PD-L1 interacted with several cytoskeleton proteins including Vimentin (VIM) and Keratins (KRTs) (Supplementary Table 3), we further speculated that binding to cytoskeleton might be important for PD-L1 nucleocytoplasmic translocation. Interestingly, a previous study reported enrichment of nuclear PD-L1 in circulating tumour cells when using Vimentin as a sorting marker32. Given that Vimentin plays a critical role in mediating epithelial-to-mesenchymal transition (EMT) and metastasis, metastatic cells with high Vimentin expression might accumulate nuclear PD-L1 to confer evasion of immune surveillance during metastasis. Indeed, Vimentin-high cell lines displayed higher PD-L1 expression in cytoskeletal and nuclear soluble fractions, compared with Vimentin-low cell lines (Fig. 5a–c; Extended Data Fig. 4f,g). Mechanistically, PD-L1 interacts with Vimentin via C-tail of PD-L1 (Fig. 5d,e). However, the interaction of PD-L1 with Vimentin was not attenuated by K263Q mutation, thereby refuting a possible PD-L1-acetylation dependent regulation of this process (Fig. 5f). Intriguingly, depletion of VIM attenuated PD-L1 expression in cytoskeletal and nuclear soluble fractions (Fig. 5g; Extended Data Fig. 4h). In supporting this notion, induction of Vimentin by TGFβ1 treatment33 enhanced PD-L1 nuclear translocation (Extended Data Fig. 4i,j). Together, these findings demonstrate that nucleocytoplasmic translocation of PD-L1 might occur in a cytoskeleton-dependent manner.
Figure 5 |. PD-L1 nuclear translocation process requires Vimentin and Importin 1α.
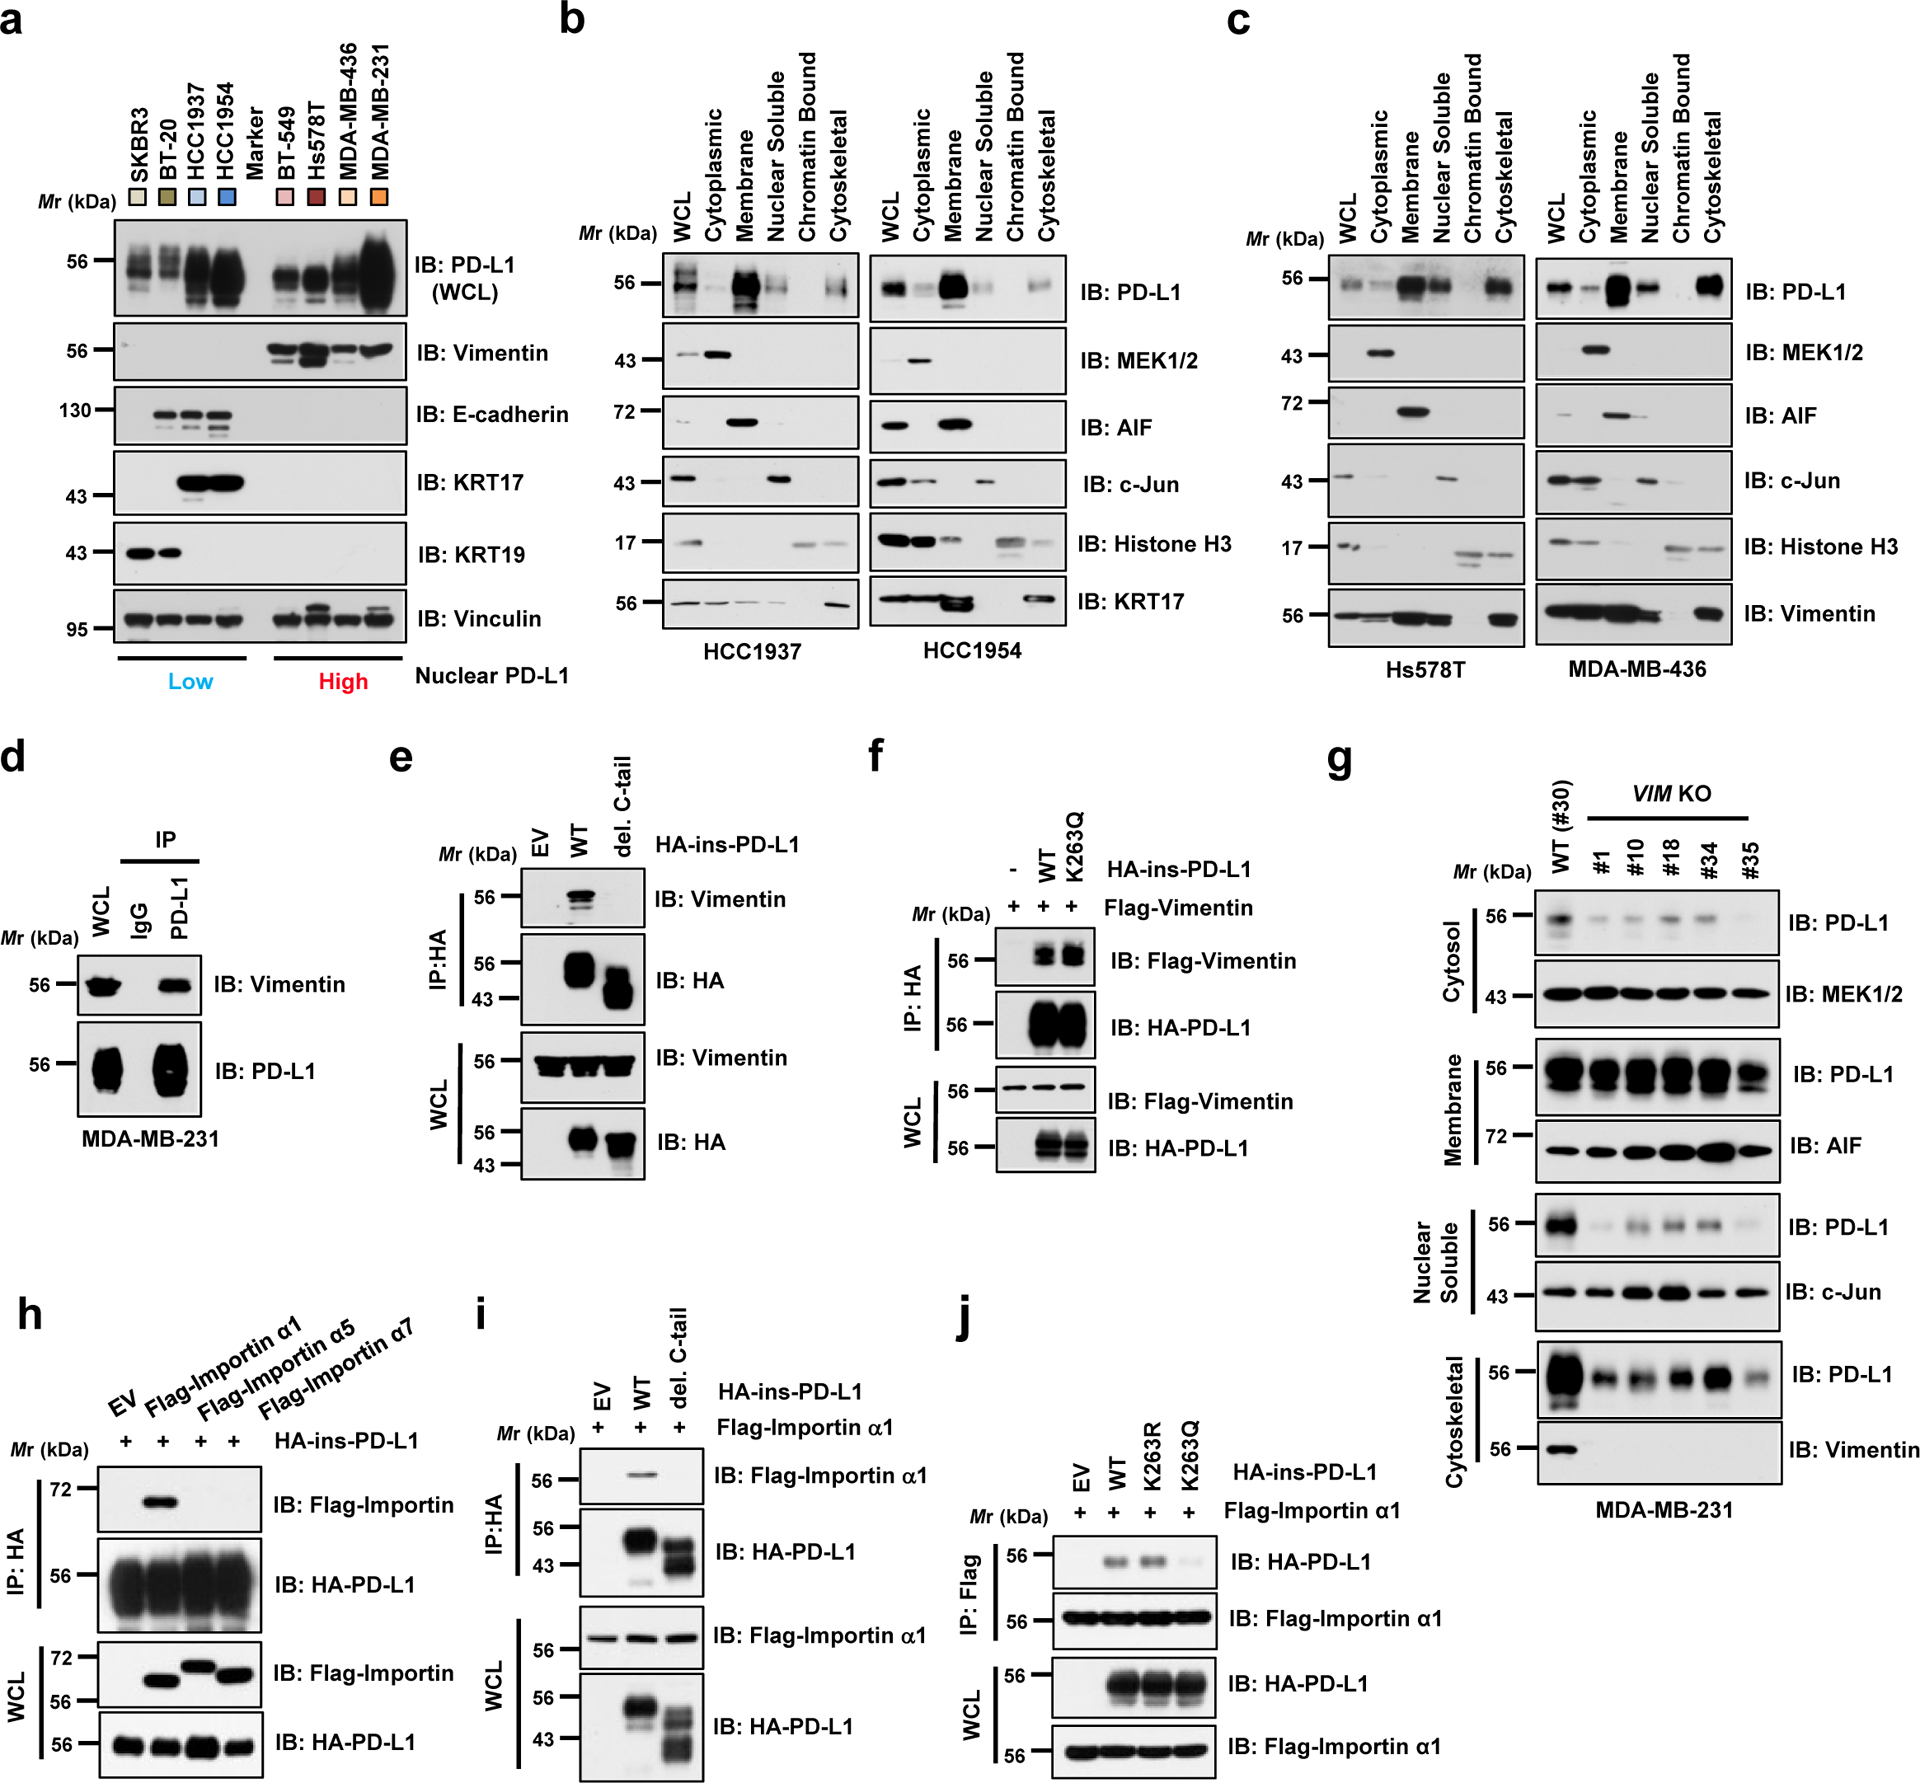
a. IB analysis of WCL derived from a panel of breasts cancer cell lines with differently expressed cytoskeletal proteins. b. Fractionation analysis using a kit from Thermo Scientific™ for PD-L1 from Vimentin-low breast cancer cell lines, HCC1937 and HCC1954. c. Fractionation analysis for PD-L1 expression in Vimentin-high breast cancer cell lines, Hs578T and MDA-MB-436. d. IB analysis of WCL and anti-PD-L1 IPs derived from MDA-MB-231 cells. e. IB analysis of WCL and anti-HA IPs derived from MDA-MB-231 PD-L1 KO cells transduced with HA-ins-PD-L1 WT or its del. C-tail mutant virus. f. IB analysis of WCL and anti-HA IPs derived from 293T cells transfected with Flag-tagged Vimentin and HA-ins-PD-L1 WT or K263Q mutant constructs. g. Fractionation analysis for PD-L1 in MDA-MB-231 WT (#30) or Vimentin (VIM) KO single cell clones (#1, 10, 18, 34 and 35). h. IB analysis of WCL and anti-HA IPs derived from 293T cells transfected with HA-ins-PD-L1 and indicated Flag-tagged Importin constructs. i. IB analysis of WCL anti-HA IPs derived from 293T cells transfected with Flag-Importin α1 (IPOA1/KPNA2) and indicated HA-ins-PD-L1 WT or del. C-tail constructs. j. IB analysis of WCL anti-Flag IPs derived from 293T cells transfected with Flag-Importin α1 and indicated HA-ins-PD-L1 WT, K263R or K263Q mutant constructs.
The western blots in a–j were performed for n=2 independent experiments with similar results. Unprocessed immunoblots are shown in Source Data Fig. 5.
Importin α family proteins regulate protein nuclear translocation34, and our MS analyses identified various Importin components as PD-L1 interacting proteins (Supplementary Table 3). Therefore, we next focused on the mechanism of nuclear translocation via the Importin complex. Treatment of Ivermectin35, an inhibitor of importin α/β-dependent nuclear import, reduced the abundance of nuclear PD-L1 (Extended Data Fig. 4k). We also observed that PD-L1 specifically interacted with Importin α1 (IPOA1/KPNA2), but not α5and α7 via C-tail of PD-L1 (Fig. 5h,i). Importantly, K263Q mutant failed to interact with Importin α1 (Fig. 5j), suggesting that K263 deacetylation is likely critical for the interaction. Thus, we propose a model in which deacetylation of PD-L1 by HDAC2 on plasma membrane enables PD-L1 to interact with HIP1R and cargo proteins for endocytosis and with Vimentin to traffic through the cytoskeleton, and finally translocate into the nucleus via Importin α1 (Extended Data Fig. 4l).
Nuclear PD-L1 regulates gene expression
Previous studies showed that several membrane proteins including EGFR, Insulin Receptor (IR) and Amphiregulin, translocate into the nucleus to regulate gene transcription14, 36, 37. Notably, consistent with a recent report that PD-L1 interacted with negatively charged RNA38, we found that PD-L1 could directly bind with DNA in vitro and in cells (Extended Data Fig. 5a,b). Both C-tail deletion and treatment with HDAC inhibitor decreased PD-L1 binding to DNA (Extended Data Fig. 5c,d), suggesting that PD-L1 interacts with DNA through the positively charged Lys residues in the C-tail, which is subjected to acetylation-mediated inhibition. These results further suggest that PD-L1 might regulate gene transcription via binding to DNA.
To further explore physiological function of PD-L1 on DNA, we performed RNA-sequencing analysis to compare gene expression profiles between PD-L1 WT and KO cells (Extended Data Fig. 5e). Interestingly, we found that PD-L1 deficiency in cancer cells down-regulated a panel of immune response-related genes involved in pathways of type I interferon (IFN) signalling, IFNγ-mediated signalling, NF-κB signalling and antigen processing and presentation via MHC I (Fig. 6a–c; Extended Data Fig. 5f–j; Supplementary Table 4,5). Indeed, we confirmed that PD-L1 depletion reduced expression of NF-κB signalling-related genes and MHC class I genes by qRT-PCR (Fig. 6d). Furthermore, the results from RNA-sequencing analysis and qRT-PCR analysis revealed that reintroducing PD-L1 WT, but not the acetylation-mimetic K262Q (in mouse) or K263Q (in human) mutant, could partially rescue the expression of down-regulated IFNs and NF-κB signalling genes in PD-L1 KO cells (Fig. 6e; Extended Data Fig. 5k–m), supporting that K263 acetylation might inhibit PD-L1 nuclear localization to potentially impact gene transcription. Conceivably, highly expressed PD-L1 in tumour cells may subsequently transactivate a cohort of genes of the IFN, NF-κB and MHC I pathways, leading to relatively high response to PD-L1/PD-1 blockade in clinical studies9, 39.
Figure 6 |. Nuclear PD-L1 regulates gene expression of immune response and regulatory pathways.
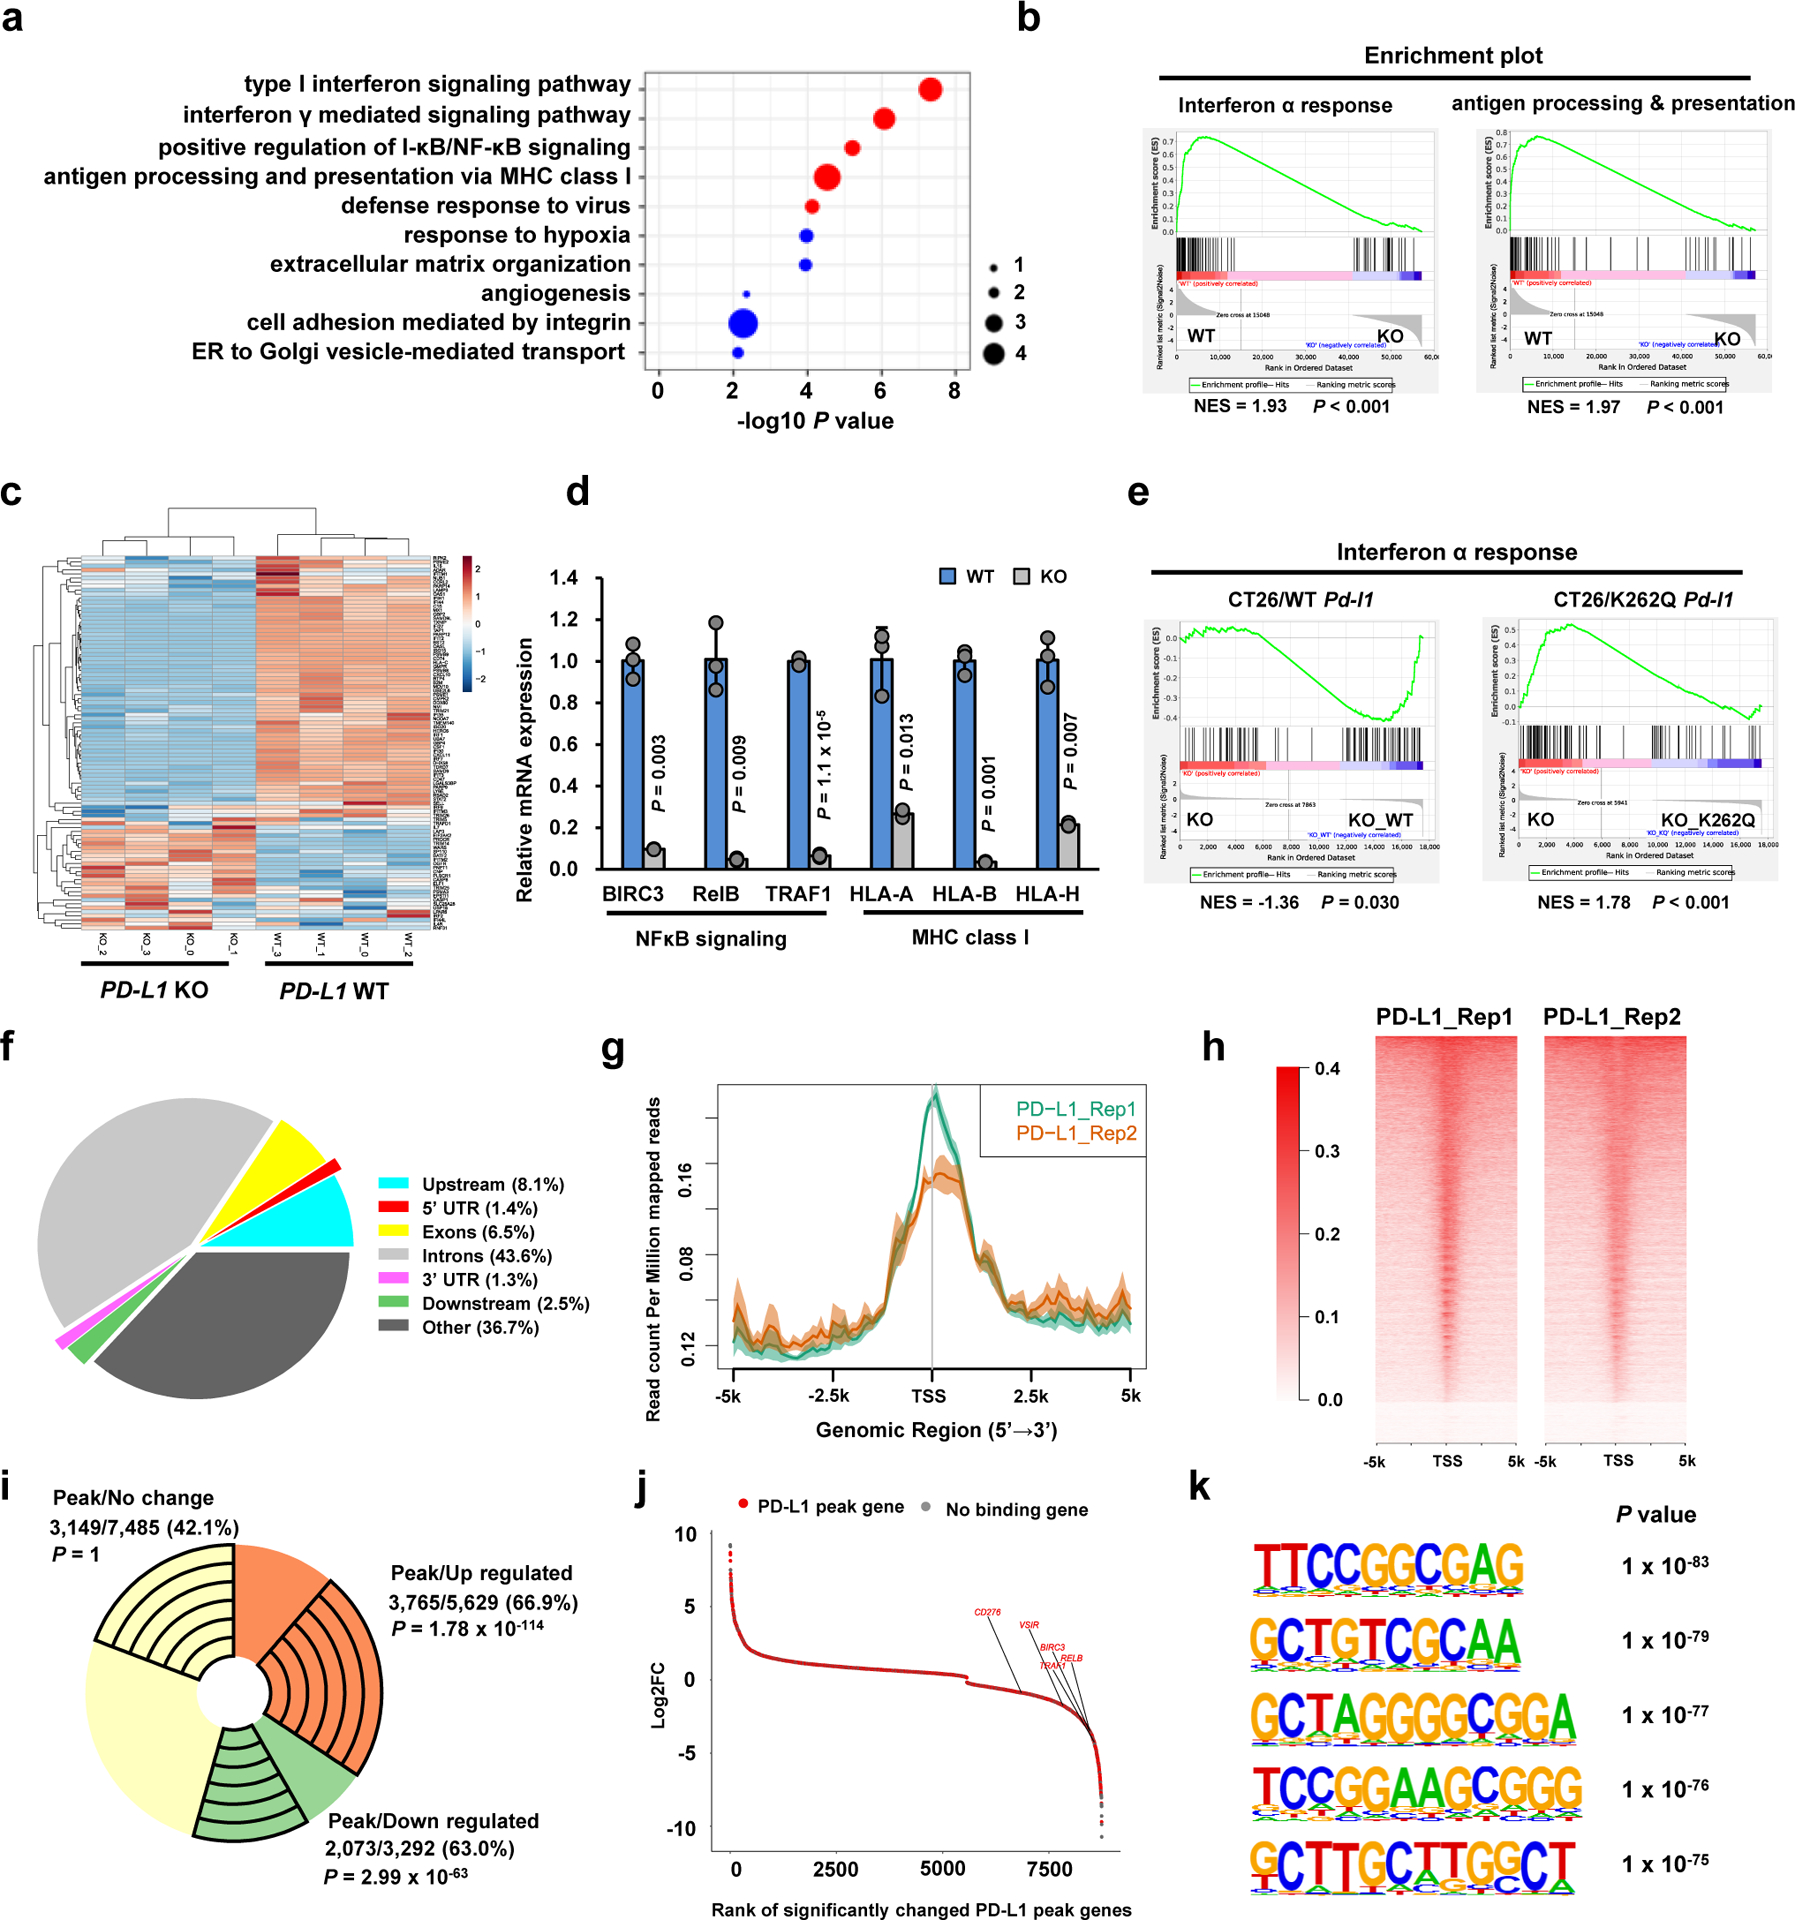
a. Top 10 enriched GO (biological process) terms of down-regulated genes (n=3,292) upon PD-L1 KO in MDA-MB-231 cells (n=4 biologically independent sequenced samples/group) analyzed by modified Fisher’s exact test with Benjamini-Hochberg correction. Immune response-related terms are marked in red. Dot size indicates the ‘Fold enrichment’. b. Down-regulated GSEA signatures upon PD-L1 KO in MDA-MB-231 cells (n=4 biologically independent sequenced samples/group). P-value was calculated using Kolmogorov-Smirnov statistic. c. Heatmap display of the interferon α genes in MDA-MB-231 WT and PD-L1 KO cells. d. qRT-PCR analysis of the indicated genes from MDA-MB-231 WT and PD-L1 KO cells. Data are shown as the mean ± s.d. of n=3 independent experiments. P-values were calculated using a two-tailed Student’s t-test. e. GSEA signatures of ‘Interferon α response’ upon re-expressing mouse WT or K262Q mutant Pd-l1 in Pd-l1 KO CT26 cells (n=3 biologically independent sequenced samples/group), analyzed using Kolmogorov-Smirnov statistic. f. Genomic distribution of HA-tag ChIP-seq peaks in MDA-MB-231 PD-L1 KO cells expressing HA-tagged-PD-L1. g. PD-L1 ChIP-sequencing signal height and position relative to transcription start sites (TSS) for all genes in MDA-MB-231 cells. Two replicates are shown. The line means the average profile of genes; while the shading indicates standard errors (s.e.) of all human hg38 genes (n=58,713). h. ChIP-sequencing density heatmap of PD-L1 enrichment in MDA-MB-231 cells, within 5 kb around TSS. Gene order was arranged from highest to lowest density. i. A pie-chart depicting the fraction of genes with PD-L1 peaks among up-regulated, down-regulated or no change genes upon PD-L1 KO in MDA-MB-231 cells. The exact numbers of genes, percentage and P-values (hypergeometric test) in each group are shown. j. Rank-ordered depiction of the Log2 fold change for each significantly changed gene upon PD-L1 KO. The 5775 genes that have PD-L1 binding peaks are depicted in red. Grey dots indicate genes that have no PD-L1 binding. k. Top enriched motifs in the PD-L1 binding sites (n=50,738) in MDA-MB-231 cells. P-value was calculated using hypergeometric distributions.
Statistical source data are available in Statistical Source Data Fig. 6.
To dissect the nuclear roles of PD-L1 in regulating gene expression, we performed chromatin immunoprecipitation coupled with ultra-high-throughput DNA sequencing (ChIP-seq) analysis using MDA-MB-231 PD-L1 KO cells in which we re-introduced HA-tagged PD-L1. Notably, we observed an over 60% overlap between PD-L1 ChIP-seq peak genes and differentially expressed genes in PD-L1 KO cells by RNA-seq analysis (Fig. 6f–i). Moreover, genes identified to be downregulated in PD-L1 KO cells such as NF-κB signalling-related genes were found to possess PD-L1 binding peaks by ChIP-seq analysis (Fig. 6j). This result suggests a model in which nuclear PD-L1 might specifically trigger gene expression involved in immune response pathways to modulate the anti-tumor immune response. In support of this notion, we identified a subset of de novo PD-L1 specific binding motifs and canonical DNA binding motifs of various transcriptional factors (Fig. 6k; Supplementary Table 6,7). Comparing DNA binding patterns with other transcription factors, we found a positive correlation with some transcription factors related to immune response such as STAT3, RelA/p65 and c-Jun40 (Extended Data Fig. 5n). Indeed, PD-L1 could interact with RelA and interferon-regulatory factor (IRF) proteins (Extended Data Fig. 5o–q), indicating that PD-L1 can likely interact with transcriptional factors on DNA to affect transcription events involved in anti-tumor immunity.
Thus, our findings suggest a model underlying how PD-L1 expression correlates with the ‘cold tumour’ versus ‘warm tumour’ in response to PD-1 blockade. Firstly, highly expressed PD-L1 on the plasma membrane engages PD-1 on T cells to suppress T cell activation; secondly, PD-L1 in the nucleus enhances the activation of multiple immune response pathways to build up a positive feedback loop of increased PD-L1 expression to foster the evasion of immune surveillance. On the other hand, nuclear PD-L1 also stimulates the inflammation pathway and increases neoantigen presentation, which might contribute to the observed responsiveness to anti-PD-1/PD-L1 treatment in patients with high PD-L1 expression (Extended Data Fig. 5r).
Blocking PD-L1 nuclear translocation enhances PD-1 blockade therapy
Unexpectedly, aside from these inflammation-stimulating aspects of PD-L1 functions, our RNA-seq data showed that several immune checkpoint genes such as PD-L2, VISTA and B7-H3 were also downregulated by PD-L1 depletion (Fig. 7a). These results were validated by qRT-PCR and western blot analyses in PD-L1 KO and knockdown cells (Figs. 7b–d; Extended Data Fig. 6a–d). Especially, PD-L2 and VISTA expression positively correlated with PD-L1 expression in human breast cancer cells (Extended Data Fig. 6e–g). Since PD-L2, VISTA and B7-H3 are also involved in evasion of immune surveillance41, our findings suggest that nuclear PD-L1 could potentially upregulate these immune checkpoint genes in tumour cells to acquire resistance to PD-L1/PD-1 blockade.
Figure 7 |. Nuclear PD-L1 regulates gene expression of immune response and regulatory pathways to impact the efficacy of anti-PD-1 immunotherapy.
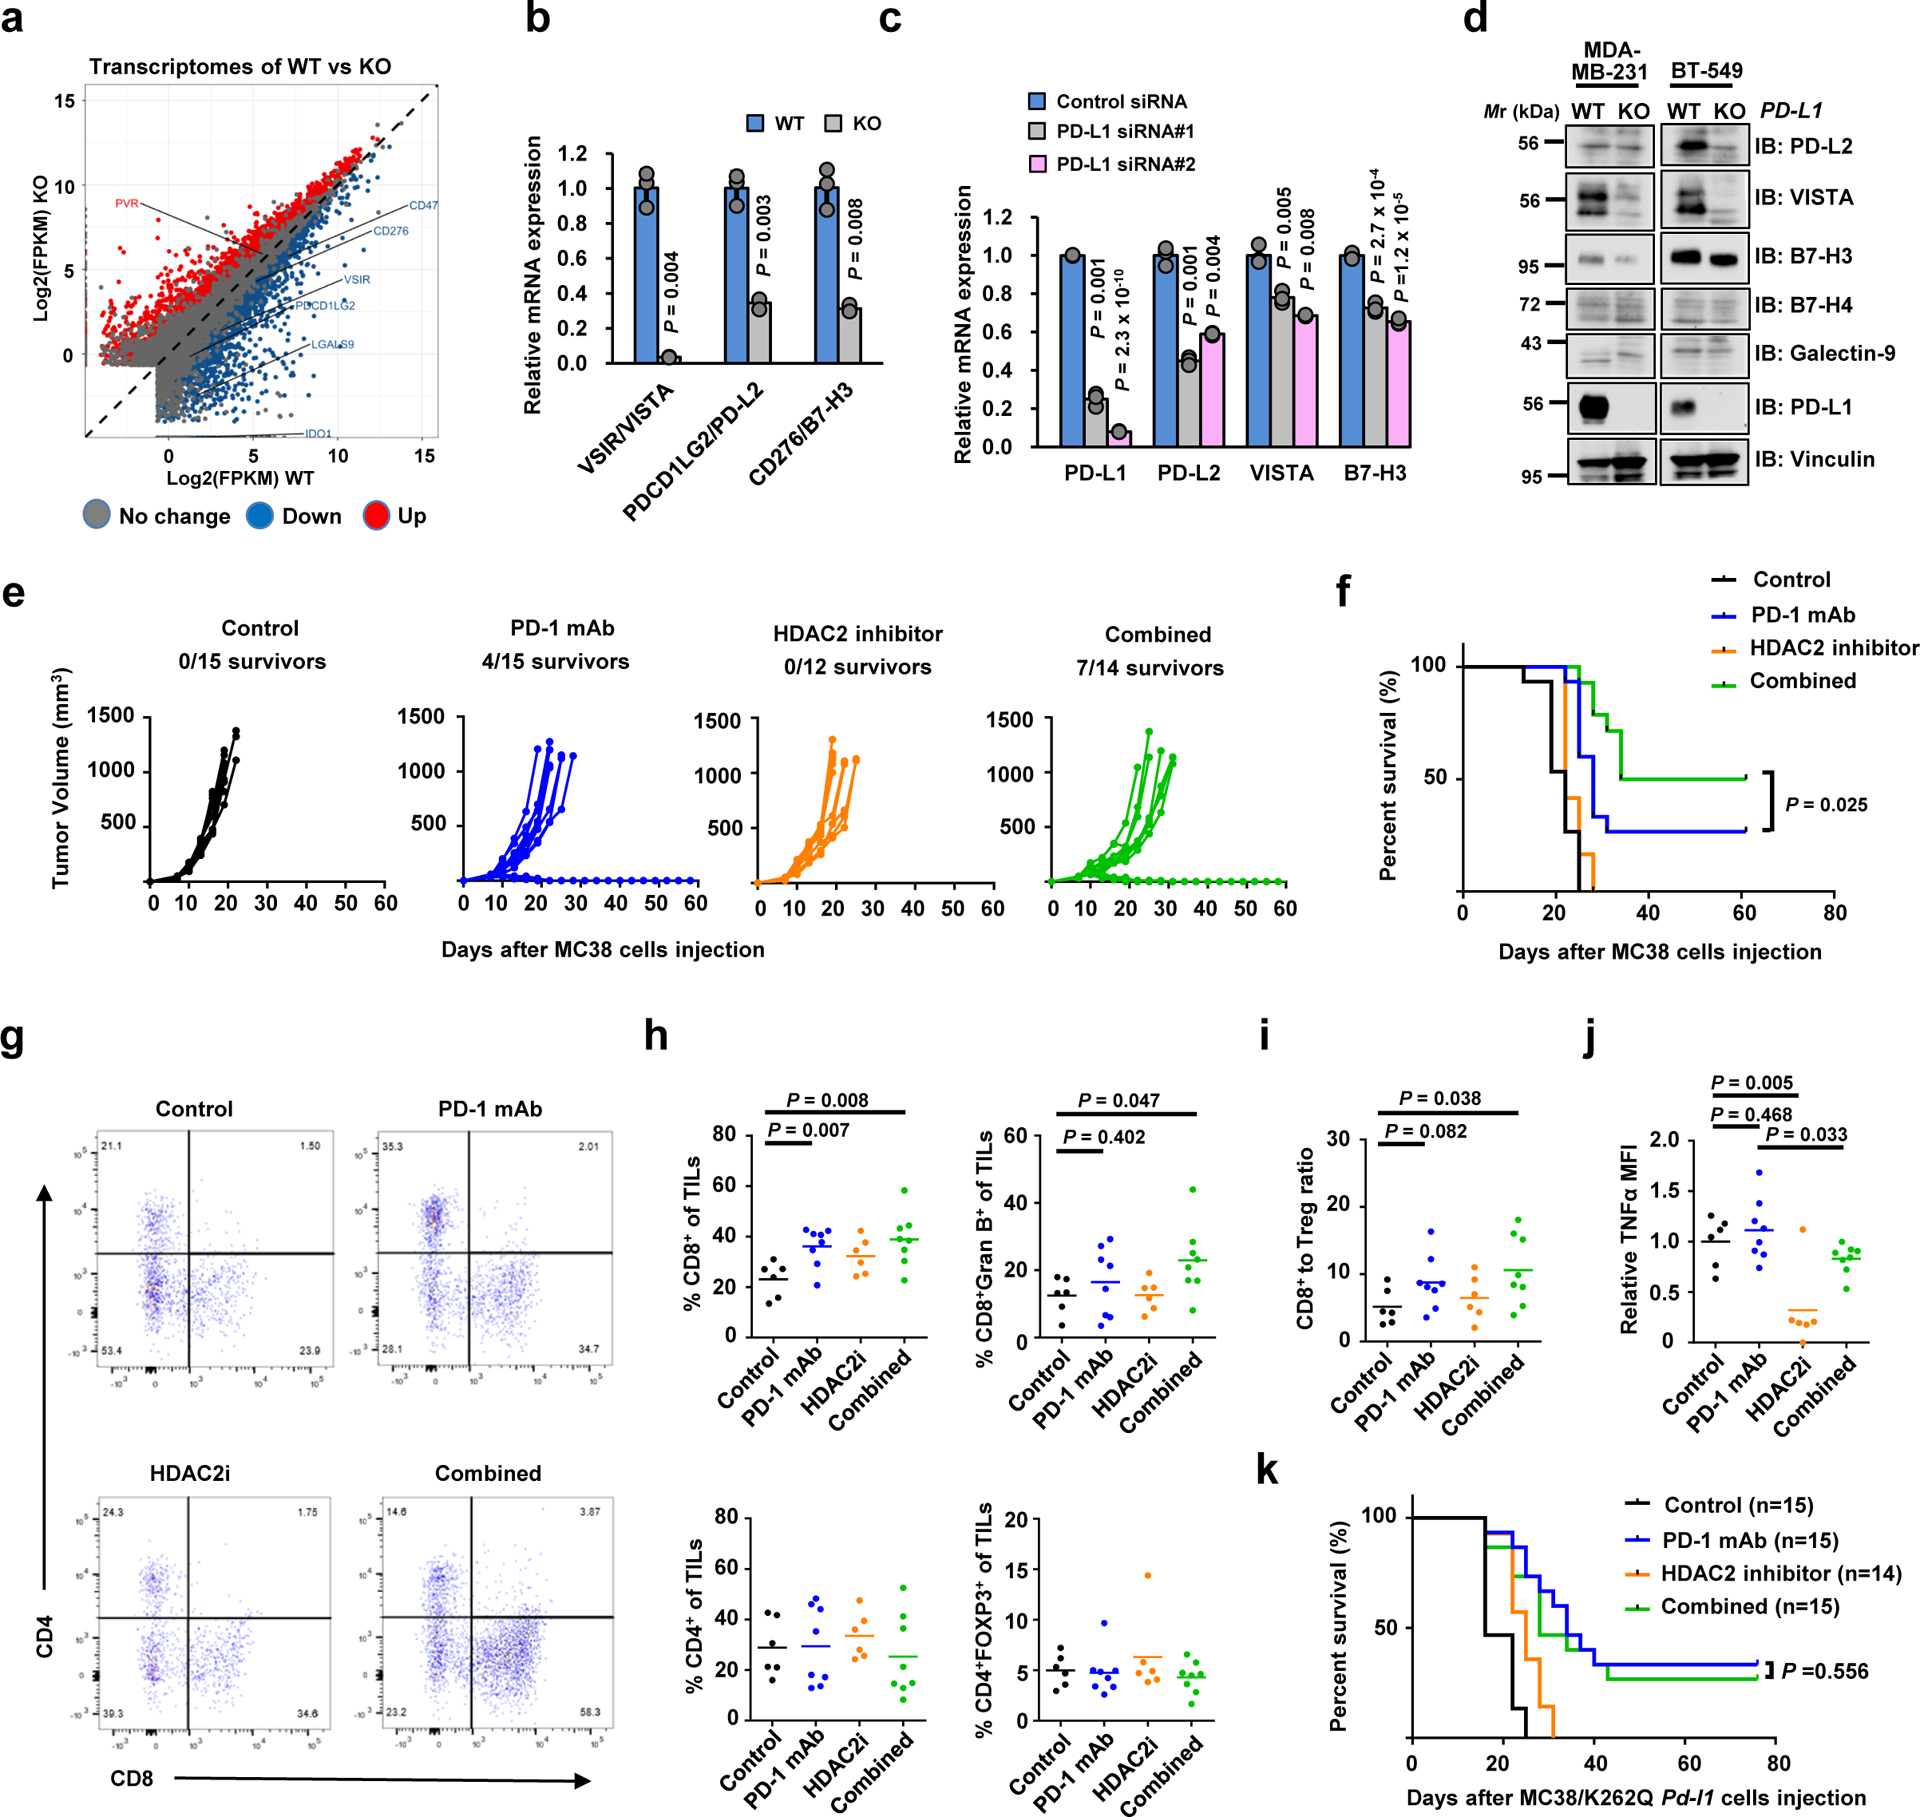
a. Scatter plot of the transcriptome of MDA-MB-231 cells upon PD-L1 KO. b. qRT-PCR analysis of the indicated genes from MDA-MB-231 WT or PD-L1 KO cells. Data are shown as the mean ± s.d. of n=3 independent experiments. c. qRT-PCR analysis of the indicated genes from MDA-MB-231 cells transfected with control siRNA or PD-L1 siRNAs. Data are shown as the mean ± s.d. of n=3 independent experiments. d. IB analysis of WCL derived from WT or PD-L1 KO MDA-MB-231 and BT-549 cells. The western blots were performed for n=2 independent experiments with similar results. e. Volumes of MC38 syngeneic tumours treated with control antibody (black lines, n=15), anti-PD-1 mAb (blue lines; n=15), the HDAC2 inhibitor Santacruzamate A (orange lines; n=12) or combined therapy (green lines; n=14) were plotted individually. f. Kaplan-Meier survival curves for each treatment group (Control, n=15; PD-1 mAb, n=15; HDAC2i, n=12; combined, n=14). P value was calculated using Gehan-Breslow-Wilcoxo test, two sided. g. Representative dot plots of CD4+ and CD8+ TILs in MC38 syngeneic tumours. h. Proportions of CD8+, CD8+Gran B+, CD4+ and CD4+FOXP3+ T cells out of CD45+CD3+ TILs in MC38 syngeneic tumours treated with control antibody (n=6), anti-PD-1 mAb (n=8), HDAC2 inhibitor (n=6) or combined therapy (n=8). i. The CD8+ T cells to Treg (CD4+FOXP3+) ratio in the treated MC38 tumours from g was calculated. j. TILs from treated MC38 tumours from h were incubated with cell stimulation cocktail for 4 hours, and expression levels (MFI) of TNF-α were examined. k. Survival curves of MC38/K262Q Pd-l1 tumour-bearing C57BL/6 mice treated as indicated. P value was calculated using Gehan-Breslow-Wilcoxo test, two sided.
The P-values in b, c and h-j were calculated using a two-tailed Student’s t-test. Each circle in h-j represents a single tumour, shown with the mean value of each group. Unprocessed immunoblots are shown in Source Data Fig. 7. Statistical source data are available in Statistical Source Data Fig. 7.
Based on our findings that HDAC2 triggers the nuclear translocation of PD-L1 to alter gene transcription, we hypothesize that pharmacological inhibition of HDAC2 would reduce nuclear PD-L1 and might represent a potential strategy for enhancing the efficacy of PD-1 blockade-based immunotherapy. Bioinformatic database analysis showed that HDAC2 mRNA was elevated in various tumours compared with normal tissues (Extended Data Fig. 6h). Higher HDAC2 or Vimentin level was correlated with poor overall survival rates and potential worse response for PD-1 antibody therapy (Extended Data Fig. 6i–k). Moreover, treatment with HDAC2 inhibitor could also induce interferon type III-related genes, IL28A and IL28B, resulting in STAT1 stimulation (Extended Data Fig. 6l,m). HDAC2 inhibition didn’t alter expression of endogenous retroviral genes (ERVs). However, the double-stranded RNA (dsRNA) pathogen recognition receptors-related genes as well as MHC class I antigen presenting genes were significantly elevated (Extended Data Fig. 6n–p), suggesting that HDAC2 inhibition might induce a microenvironment with high infiltrating immune cells to improve the responsiveness to PD-1 blockade (Extended Data Fig. 6q).
Pharmacologic inhibition of HDAC2 might synergize with PD-1/PD-L1 blockade for cancer treatment, therefore, we examined this hypothesis using the MC38 syngeneic mouse tumour model treated with PD-1 antibody and/or HDAC2 inhibitor. Notably, compared to anti-PD-1 treatment group, combination of HDAC2 inhibitor and anti-PD-1 markedly retarded tumour growth and increased the survival rate (Fig. 7e,f). However, the therapeutic benefit of combination treatment was not observed in immunocompromised nude mice (Extended Data Fig. 7a,b), supporting the notion that the anti-tumour effect depends on T cells. Next, we evaluated tumor-infiltrating lymphocytes (TILs) in tumours and found significantly elevated proportions of CD8+ and CD8+Gran B+, but not CD4+ or CD4+FOXP3+ T cells out of CD45+CD3+ TILs in the combined treatment group (Fig. 7g,h). Notably, the CD8+ T cells to Treg (CD4+FOXP3+) ratio, a potential predictor of response to immunotherapy, was also elevated in combination treatment group (Fig. 7i). Among various cytokines, TNFα was reduced in HDAC inhibitor treatment group but kept a relatively moderate level in combination treatment group (Fig. 7j; Extended Data Fig. 7c). These findings are consistent with recent reports that blocking TNFα could overcome resistance to immunotherapy42, 43. Intriguingly, PD-1 antibody treatment increased nuclear PD-L1 signal, which was somehow attenuated after the combined treatment with HDAC2 inhibitor, however, the underlying mechanism remains to be elucidated (Extended Data Fig. 7d).
To further examine the role of acetylation in PD-L1 functions, we compared the sensitivity to PD-1/PD-L1 blockade between WT Pd-l1 and K262Q mutant in CT26 syngeneic tumour model. Strikingly, the mice expressing K262Q-Pd-l1 showed better response and improved survival after treatment with anti-PD-1 antibody, compared to the WT group (Extended Data Fig. 7e,f). Moreover, the enhanced therapeutic effects in MC38/K262Q Pd-l1 could not be observed in the combined treatment group (Fig. 7k; Extended Data Fig. 7g), suggesting an acetylation-dependent PD-L1 translocation confers therapeutic benefit of the combined treatment.
Discussion
Independent of its immune-suppressive function on plasma membrane, PD-L1 was shown to endow tumour cells with anti-apoptotic ability44, promote mTOR activity and regulate glycolytic metabolism45. In this study, we demonstrated that a portion of PD-L1 translocates into the nucleus to regulate expression of pro-inflammatory and immune response-related genes, suggesting that transcriptional regulation by PD-L1 might foster immune inflammation in the local tumour microenvironment to render the tumour more sensitive to immune checkpoint blockade therapy. Our findings explain why high PD-L1 levels predicts better response to PD-1 blockade as found in clinical trials46. Moreover, we found the nuclear function of PD-L1 is controlled by K263 acetylation in the C-tail. Notably, nuclear PD-L1 is enriched in lung metastatic tumours, suggesting a potential interplay between tumour aggressiveness and PD-L1 translocation. Further studies to clarify how nuclear PD-L1 could contribute to distant metastasis of cancer are warranted.
Surprisingly, nuclear PD-L1 also triggers expression of other immune checkpoint molecules which are not targeted by PD-1/PD-L1 blockade, leading to possible acquired immunotherapy resistance (Extended Data Fig. 7h). Hence, blocking the nuclear translocation of PD-L1 with HDAC2 inhibitor might potentially decrease transcription of these immune checkpoint genes, resulting in increased CD8+ cytotoxic T cell infiltration and decreased TNFα levels in tumors, which in turn augments the anti-tumour immune response triggered by therapeutic antibodies against PD-1. Thus, our studies provide a molecular mechanism and rationale for combining HDAC2 inhibition with PD-1/ PD-L1 blockade as an effective immunotherapy for cancer.
Methods
Cell culture, transfection, virus infection and treatments
HEK293T, Hs578T, MDA-MB-231, MDA-MB-436, A375, SW839, RAW264.7, MEFs, B16F10, MCF7, MDA-MB-468, SKBR3, BT-20, T47D and MC38 cells were cultured in DMEM medium. BT-549, HCC1937, HCC1954, DU145, ZR-75–1 and CT26 cells were cultured in RPMI 1640 medium. All medium contains 10% FBS, 100 units of penicillin and 100 μg/ml streptomycin. The source information and authentication status of all cell lines is summarized in the Supplementary Table 8. For the BT-20 line, where some stocks have been shown to be misidentified47, we have performed STR analysis and the ATCC certification report in the Extended data Fig.1b demonstrated that the BT-20 line used in this study is not cross-contaminated. MDA-MB-231 PD-L1 KO cells and BT549 PD-L1 KO cells were kindly gifted from Dr. Mien-Chie Hung. Transfection was performed using PEI (Polysciences) or Lipofectamin (Thermo Fisher Scientific). For lentiviral infection, 293T cells were transfected with packaging vectors (delta-8.9 and VSVG) and GFP shRNA, PD-L1 shRNA, HDAC2 shRNA, p300 shRNA pLKO plasmids, or pLenti-HA-ins-PD-L1 wild-type (WT) or its C-tail deletion mutant plasmids, then the virus particles were collected for infection. Cells were selected with Puromycin or Hygromycin. Silencer Select Negative Control No. 2 siRNA, HDAC6 siRNA (#M-003499-00-0005) and PD-L1 specific siRNAs (#s26547 and #s26548) were purchased from Dharmacon/Horizon Discovery (Cambridge, UK). HDAC3 siRNA (#sc-35538) was obtained from Santacruz Biotechnology. HDAC1 (#Hs01_00142115) and HDAC2 (#Hs01_00079968) siRNAs were purchased from Merck. Transfection of siRNAs was performed using Lipofectamine RNAi MAX (Thermo Fisher Scientific). For TGFβ1 treatment, cells cultured in 1% FBS were treated with 10 ng/ml recombinant human TGFβ1 (BioLegend). Cycloheximide assays were performed as described previously48. MG-132 (MBL-PI102) and Tunicamycin (T7765) were purchased from Enzo Life Sciences and SIGMA, respectively. Cycloheximide (AC357420050) was purchased from Fisher Scientific. Santacruzamate A (#S7595) and Ivermectin (#S1351) were purchased from Selleckchem. A485 (#6387) was purchased from Tocris. ACY957 and ACY1215 were provided by Acetylon Pharmaceuticals. Filipin III (#F4767) and Pitstop (#ab120685) were purchased from Merck and Abcam, respectively.
Plasmids
Importin α1, α5, α7, SIRTs, HDACs and IRFs cDNA were amplified and cloned into pcDNA3-Flag vector as previously described11,12. CBP, p300, GCN5, PCAF and Tip60α cDNA were amplified and cloned into the pcDNA3-HA vector. Mouse Hip1r-GFP and Halo-tag vectors were obtained from Addgene. C-termial, Myc-tagged PD-L1 and glycosylation-deficient 4NQ (N35, N192, N200 and N219) mutant PD-L1 were kindly gifted from Dr. Mien-Chie Hung. Adaptin β1, β2, β3 and β4 cDNA were provided by Dr. Kazuhisa Nakayama and Dr. Juan S. Bonifacino. cDNA encoding C-terminal domain of PD-L1 (AA 260–290) was amplified and subcloned into CMV-GST vector. To generate N-terminal HA-tag-inserted PD-L1, HA sequences were inserted after signal peptide sequence within full-length or C-tail deletion mutant (AA 263–290) of PD-L1. Site-directed mutagenesis was performed by PCR and verified by sequencing. Vimentin cDNA was amplified from HA-Vim plasmid (#46315, Addgene) and cloned into p3xFlag-CMV-10 vector. RelA (#20012), RelB (#20017) and c-Rel (#20013) plasmids were purchased from Addgene. Lentiviral shRNAs for PD-L1, p300, CBP and HDAC2 were purchased from Dharmacon. PD-L1 cDNA was amplified and sub-cloned into pLenti-CMV-Hygro vector. For generating CRISPR cell lines, sgRNAs were sub-cloned into pLenti-CRISPRV2 GFP vector (Addgene). The sgRNA sequence for human Vimentin knockout was 5′-TCCTACCGCAGGATGTTCGG-3; for mouse Vimentin was 5′-GTGGCTCCGGCACATCGAGC-3′; for mouse PD-L1 was 5′-GTGACCACCAACCCGTGAGT-3′; for human HDAC2 was 5′-CCTCCTTGACTGTACGCCAT-3′.
qRT-PCR analysis
Total RNA was isolated using Qiagen RNeasy mini kit (Qiagen). cDNA was synthesized using iScript RT Supermix for RT-qPCR Kit (Bio-Rad), and qRT-PCR was performed with SYBR Select Master Mix (Thermo Fisher Scientific). The primer information is shown in the Supplementary Table 9.
Immunoblot and immunoprecipitation
Cells were lysed with EBC buffer (50 mM Tris pH 7.5, 120 mM NaCl, 0.5% NP-40) with protease inhibitors (#PIA32953, Thermo Scientific), phosphatase inhibitors (# B15002, Bimake), and/or 2μM TSA (T8552, Sigma) as described previously49. Lysates were separated by SDS-PAGE and transferred to PVDF membranes. The membranes were incubated with antibodies as listed below: anti-acetylated Lys (#9441, Cell Signaling Technology, CST), anti-human PD-L1 (#13684, CST), anti-mouse PD-L1(EPR20529, #ab213480, Abcam), anti-PD-L2 (#82723, CST), anti-VISTA (#64953, CST), anti-B7-H3 (#14058, CST), anti-B7-H4 (#14572, CST), anti-Galectin-9 (#54330, CST), anti-AIF (#5318, CST), anti-Histone H3 (#4499, CST), anti-MEK1/2 (#8727, CST), anti-GST (#2625, CST), anti-Tubulin (#T-5168, Sigma), Acetyl-α-Tubulin (Lys40) (#5335, CST), anti-c-Jun (#9165, CST), anti-Vimentin (#5741, CST), anti-E-Cadherin (#3195, CST), anti-KRT17 (#4543, CST), anti-KRT19 (#sc-376126, Santa Cruz Biotechnology), anti-HIP1R (#16814–1-AP, Proteintech Group), anti-HDAC2 (#57156, CST), rabbit polyclonal anti-Myc-tag (#2278, CST), mouse monoclonal anti-Myc-tag (#2276, CST), anti-HA (MMS-101P, BioLegend), anti-Flag (#F-3165, Sigma) or anti-GFP (#632381, Clontech). These primary antibodies were used at 1:1000 dilution in 5% non-fat milk. Anti-human PD-L1 extracellular domain (clone 368A.5A4, generated in the laboratory of Dr. Gordon Freeman)50 antibody was used at 1:500 dilution. The anti-acetyl-K263-PD-L1 antibody (acetyl-Lys263-PD-L1) antibody (generated by ABclonal Technology Biotech) was used at 1:200 dilution. As secondary antibodies, peroxidase-conjugated anti-mouse secondary antibody (#A-4416, Sigma-Aldrich) or anti-rabbit secondary antibody (#A-4914, Sigma-Aldrich) was used at 1:3000 dilution. For the detection of K263 acetylation, VeriBlot for IP Detection Reagent (HRP) (#ab131366, Abcam) was used at 1:500 dilution. For immunoprecipitation, lysates were incubated with HA agarose (#A-2095, Sigma-Aldrich), Myc agarose (#A-7470, Sigma-Aldrich), Flag agarose (#A-2220, Sigma-Aldrich), anti-PD-L1 clone 29E.12B1 (generated in the laboratory of Dr. Gordon Freeman)51. Immune complexes were washed five times with NETN buffer (20 mM Tris [pH 8.0], 100 mM NaCl, 1mM EDTA, 0.5% NP-40).
In vivo ubiquitination assays
In vivo ubiquitination assays were performed as described previously6,12,43. Cells were treated with 30 mM MG132 for 6 hours before being lysed with buffer A (6 M guanidine-HCl, 0.1 M Na2HPO4/NaH2PO4, and 10 mM imidazole [pH 8.0]). Lysates were sonicated and incubated with nickel-nitrilotriacetic acid (Ni-NTA) beads (#30230, QIAGEN) for 3 hours at room temperature (RT). Subsequently, the beads were washed twice with buffer A, twice with buffer A/TI (1 volume buffer A and 3 volumes buffer TI), and one time with buffer TI (25 mM Tris-HCl and 20 mM imidazole [pH 6.8]).
In vitro acetylation assays
Recombinant His-tagged PD-L1 was purified from bacteria. 0.5 μg of His-PD-L1 and/or 0.5 μg of active p300 recombinant protein (#81158, Active motif) were incubated in acetylation assay buffer (50 mM Tris pH 8.0, 0.1 mM EDTA, 50 ng/μl BSA) in the presence or absence of 20 μM Acetyl-CoA (#10101893001, Sigma) for 1 hour at 30°C. For mass-spectrometric analysis, peptide (AA 261–270) was synthesized and purchased from FUJIFILM Wako and 0.5 mg of the peptide was used for the assay.
Immunohistochemistry
Specimens were fixed in 10% formalin phosphate-buffered solution for 48 hours at RT, transferred to 70% ethanol. Subsequently, tissues were paraffin embedded; 5 μm paraffin sections were used for staining. Sections were deparaffinized, boiled in 10 mM sodium citrate (pH 6.0) for 10 min and incubated with 3% H2O2 for 10 mins. Blocking and antibody incubations were performed using Vector M.O.M. Immunodetection kit (BMK-2202; Vector Laboratories). PD-L1 antibody was used at 10 μg/ml (clone 298B.3C6, generated in the laboratory of Dr. Gordon Freeman)51. Chromogenic detection was achieved by using Vectastain ABC kit (PK-4000; Vector Laboratories), ImmPACT DAB substrate (SK-4105; Vector Laboratories), and counterstained using Vector Hematoxylin QS (H-3404; Vector Laboratories). Stained sections were ultimately dehydrated and mounted using Permount.
Immunofluorescence
Cells were fixed in 4% PFA for 15 min, permeabilized with 0.5% Triton X-100 for 15 min and blocked with 10% goat serum for 1hr. For frozen tumor tissues staining, 40 μm sections were pre-treated with acetone for 10 minutes. After washing with PBS, cells were stained with rat antibody against mouse PD-L1 (clone 5C5, generated in the laboratory of Dr. Gordon Freeman52), mouse antibody against human PD-L1 (clone 9A11, generated in the laboratory of Dr. Gordon Freeman50) or anti-HA tag antibody for HA-ins-PD-L1 (#2367, Cell Signaling Technology). For HA staining, cells were incubated with Tyramide Boost Kit (#B40941, Thermo Fisher Scientific) according to the manufacturer’s protocol (tyramide incubation 15 min). Then cells were incubated with NucRed Dead nuclear stain (#R37113, Thermo Fisher Scientific) for 15 min and washed with PBS. For mouse PD-L1 or human PD-L1 study, cells or tissues were stained with a donkey anti-rat or donkey anti-mouse secondary antibody (Alexa Flour 488) for 1 hr. Nuclei were stained with DAPI. For Halo-tag imaging53, cells were treated with 0.5 μM HaloTag Alexa Fluor 488 Ligand (#G1002, Promega) for 15 min. Images were captured using confocal microscopy (Nikon Ti inverted or Zeiss LSM880) and assembled using Fiji software.
Cell fractionation assays
Cells were harvested using EDTA and then counted to adjust cell numbers for each sample. Fractionation was performed using Cell fractionation kit (#9038, Cell Signaling Technology) or Subcellular Protein Fractionation Kit (#78840, Thermo Fisher Scientific). The pellet was washed one time using cold PBS between every step.
DNA binding assays
For preparation of biotin-DNA, two oligos (5’-bio-TGCAGCTGGCACGACAGGTTGCAGCGAGTC-3’; 5’-GACTCGCTGCAACCTGTCGTGCCAGCTGCA-3’) were annealed. To prepare DNA-conjugated beads, 200 μl of 0.5 μM biotin-DNA was incubated with streptavidin-coated agarose beads (#20349, Thermo-scientific) in DNA binding buffer (10 mM Tris-HCl (pH 7.5), 100 mM NaCl, 10% glycerol, 0.01% NP-40 and 10 μg/ml BSA) at RT for 1 hr, then washed with DNA binding buffer. The beads were incubated with 1000 μg of lysate in the DNA binding buffer at 4 °C for 2 hrs and washed with binding buffer before subjected to immunoblot analyses.
ChIP and ChIP-sequencing
ChIP was performed with anti-HA-tag antibody (Abcam, ab9110) in MDA-MB-231 PD-L1 KO cells stably expressing HA-tagged PD-L1. For replicate 1, ChIP was performed using Diagenode iDeal ChIP-seq Kit for Transcription Factors (Diagenode, C01010055) with addition of ChIP cross-link Gold cross-lining reagent (C01019027). Library preparation and sequencing analysis were performed at the Molecular Biology Core facility in Dana-Farber Cancer institute. For replicate 2, ChIP was performed as described54. Qualified libraries were deep sequenced using an Illumina HiSeq 4000 per the manufacturer’s instructions at the Northwestern University.
ChIP-seq data analyses
ChIP-seq reads were aligned to the non-random chromosomes of the human (hg38 assembly) genome using Bowtie2 v2.2.955 (default parameter). Peak calling was performed using MACS2 v2.1.156 with corresponding input controls (default parameter, except: --broad and --broad-cutoff 0.05). The Bedtools v2.27.1 was used to acquire common PD-L1 binding peaks from two replicates. The GREAT software v4.0.457 (default parameter) was used to assign peaks to genes of the human hg38 assembly, and the PAVIS software58 (default parameter) was used for the peak gene annotation. De novo motif analysis was performed using HOMER software v4.10.3 among the list of sites with significant PD-L1 binding in both replicates. Selected enriched regions were aligned with each other according to the position of TSS. For each experiment, the ChIP-seq density profiles were normalized to the density per million total reads. Metagene plots and heatmaps were generated using ngsplot v2.61with color saturation as indicated. For the colocalization study, the publicly available MDA-MB-231 ChIP-seq datasets were downloaded from GEO database. These datasets were aligned to the hg38 genome using the Bowtie 2 v2.2.955 with the same parameter as PD-L1 ChIP-seq datasets. BigWig file generation for each dataset and colocalization calculation were performed using deepTools v2.5.359.
Mass spectrometry analysis
To identify the binding proteins of PD-L1, 293T cells were transfected with pcDNA3-Flag vector, Flag-tagged PD-L1, pcDNA3-HA vector or HA-ins-PD-L1. Lysates were immunoprecipitated with Flag- or HA-agarose, and then binding proteins were eluted with 2% SDS. Immunoprecipitates were digested with trypsin (#V5111, Promega) overnight. The peptides were resolved with 0.1% formic acid, desalted using C18 StageTips (Thermo Fisher Scientific), and re-dissolved in 0.1% formic acid. The obtained peptides were subjected to nanoLC-Ultra 2D analysis coupled with TripleTOF 5600 mass spectrometer (AB SCIEX) and analyzed by 2D-ICAL software v1.3.23. Gene ontology (GO) enrichment analysis was performed by Metascape60. To detect K263 acetylation of PD-L1, the synthetic peptides following in vitro acetylation assay were measured by a QTRAP5500 mass spectrometer and analyzed using ProteinPilot software v3.0.
RNA-seq and bioinformatic analyses
Total RNAs from MDA-MB-231 WT, MDA-MB-231 PD-L1 KO, CT26 WT or CT26 Pd-l1 KO cells were purified using Qiagen RNeasy mini kit (Qiagen). Library preparation (Kapa mRNAseq Hyper prep, Roche) and sequencing analysis (Illumina NS500 Single-End 75bp) were performed at the Molecular Biology Core facility in Dana-Farber Cancer institute. Total RNAs from CT26 Pd-l1 KO cells re-expressing WT or K262Q Pd-l1 were purified using Qiagen RNeasy mini kit (Qiagen). Library preparation and sequencing analysis (BGISEQ-500, Single-End 50bp) were performed by BGI-Hong Kong Co. Ltd. RNA-seq data were aligned to mm10 and hg38 using STAR v2.5.4a61 (default parameter, except: --outSAMstrandField intronMotif, --outFilterIntronMotifs RemoveNoncanonical). Differential gene expression analysis was performed using Cufflinks v2.2.162. A significant change is defined by a q value (adjusted p value using the Benjamini-Hochberg Procedure) < 0.05. Prediction of transcription factors regulating differentially expressed genes was analyzed by MetaCore software v6.33. Gene ontology analysis for enriched ‘biological process’ terms was performed using the web tool DAVID Bioinformatics Database v6.8 (https://david.ncifcrf.gov/tools.jsp)63, 64 for the ‘GOTERM_BP_DIRECT’ category. For GSEA analysis, we used the GSEA tool v3.0, with the MSigDB v6.2 Hallmarks gene sets collection and the ‘classic’ method for calculating enrichment scores65.
Transcripts and survival analyses
HDAC2 or Vimentin transcripts across all cancer types and overall survival studies of common cancer types were analyzed by the gene expression profiling interactive analysis GEPIA (http://gepia.cancer-pku.cn)66. The customized genomic analysis was based on The Cancer Genome Atlas (TCGA) data. The expression data of PD-L1, PD-L2 and VISTA in a panel of breast cancer cell lines (n=56) was obtained from GEO dataset GSE36139. The Vimentin expression and melanoma patient survival after PD-1 antibody treatment were generated by TIDE tool (http://tide.dfci.harvard.edu)67 and the source data is based on Riaz2017_PD1 cohort68.
In vivo experimental therapy in mouse model
The study is compliant with all relevant ethical regulations regarding animal research. Animal experiments were approved by Dana-Farber Cancer Institute Institutional Animal Care and Use Committee (IACUC; protocol number 04–047) or Beth Israel Deaconess Medical Center (BIDMC) Institutional Animal Care and Use Committee (IACUC: Protocol #043–2015), and performed in accordance with guidelines established by NIH Guide for the care and use of laboratory animals. The syngeneic MC38 and MC38/K262Q Pd-l1 cancer model were established by subcutaneously injecting 1×10⁵ of MC38 cells in 100 μl HBSS saline buffer into the right flank of 6~8 week-old female C57BL/6 mice (Jackson Lab, ME). For MC38 nude mice model, cells were injected into the right flank of 6~8 week-old female nude mice (T-cell deficient, Taconic # NCRNU-F). For CT26 model, 5×10⁴ of indicated CT26 subclone cells were injected into right flanks of 6~8-week-old BALB/c female mice (Jackson Lab, ME). For B16F10 primary and metastasis model, primary tumours were generated by subcutaneous injection of 2×10⁴ B16F10 cells into 6~8 week-old female C57/BL6 mice (Jackson Lab, ME). Tumours were dissected and measured after 4 weeks. Lung metastases were generated by tail vein injection of 2.5×10⁴ B16F10 cells into 6~8 week-old female C57/BL6 mice and harvesting the lungs for metastasis analysis at 4 weeks. Tumour sizes were measured every three days after implantation and tumour volume was calculated by length×width2×0.5. On day 7 after injection, animals were pooled and randomly divided. For MC38 model, mice were grouped into four groups: control antibody, PD-1 mAb (clone 29F.1A12), HDAC2 inhibitor Santacruzamate A and PD-1 mAb plus Santacruzamate A. For CT26 model, mice were grouped into two groups (control antibody and PD-1 mAb). The control and PD-1 mAb treatments were conducted by intraperitoneal injection (200 μg/mouse in 200 μl HBSS saline buffer) every three days for a total of 8 injections. Santacruzamate A treatment was given by intraperitoneal injection once a day with a dosage of 25 mg/kg (in 5% DMSO, 5% PEG 300, 5% Tween 80 in ddH2O) for three weeks with a break every week for one day. For survival studies, animals were monitored for tumour volumes for 60 days, until tumour volume exceeded 1000 mm3, or until tumour became ulcerated with ulcer diameter reaching 1 cm. Statistical analysis was conducted using the GraphPad Prism software (GraphPad Software). Kaplan–Meier curves and corresponding Gehan-Breslow-Wilcoxon tests were used to evaluate statistical differences between groups in survival studies.
Tumor infiltrating lymphocytes analysis
Nine days after the treatment of MC38 tumours with indicated compounds, tumor infiltrating lymphocytes (TILs) were isolated and stained. For stimulation, cells were incubated with cell stimulation cocktail (PMA and Ionomycin) plus protein transport inhibitor (Brefeldin A and Menesin) for 4 hrs. Cells were analysed by multicolour flow cytometry (BD LSR Fortessa X-20). Antibodies: anti-CD45 BV605 (#103140, Biolegend); anti-CD3 BV875 (#100355, Biolegend); anti-CD4 BV650 (#100469, Biolegend); anti-CD8 (#100784, Biolegend); anti-FOXP3 PerCP-Cy5.5 (#563902, BD); anti-TNFα APC (#506308, Biolegend); anti-IFNγ FITC (#505806, Biolegend); anti-IL-2 BV510 (#503833, Biolegend); anti-IL10 PerCP-Cy5.5 (#505028, Biolegend). All analyses were performed using FlowJo_V10.6.1 software (Tree Star). Gating strategy: gate cells exclude dead cells and debris based on cells size, then gate live cells based on Live-Dead NIR negative cells, then gate CD45+ cells, then gate CD45+CD3+ cells, then gate CD45+CD3+CD8+ cells and CD45+CD3+CD4+ cells. Cytokine expression was determined in the populations of CD45+CD3+cells.
Statistics and Reproducibility
All quantitative data were presented as the mean ± s.e.m. or the mean ±s.d., as indicated of at least three independent experiments or biological replicates. Statistical analyses were performed using GraphPad Prism 7 and Excel 2016 unless indicated otherwise. P value was calculated as described in the figure legend for each experiment. All statistical tests were two-sided. The P < 0.05 was considered statistically significant. All data shown are representative two or more independent experiments with similar results, unless indicated otherwise.
Data availability
The next generation sequencing (NGS) data generated in this study have been submitted to the Gene Expression Omnibus Database with accession number GSE134510, GSE146557 and GSE146648. The data from mass-spectrometric analysis was deposited in Japan Proteome Standard Repository/Database (JPOST) with the accession number: JPST000666/PXD015191 and JPST000757/PXD017707, respectively. The human cancer data were derived from the TCGA Research Network: http://cancergenome.nih.gov/, and Riaz2017_PD1 cohort68. The data-set derived from this resource that supports the findings of this study is available in GEPIA (http://gepia.cancer-pku.cn)66 and TIDE (http://tide.dfci.harvard.edu)67. Source data for Figs. 1–7 and Extended Data Figs. 1–7 are available online. All other data supporting the findings of this study are available from the corresponding author upon reasonable request.
Code availability
Custom scripts used in the study are available at https://github.com/ejgkelvin/Nuclear_PD-L1_Acetylation.
Supplementary Material
Extended Data
Extended Data Fig. 1. Lysine 263 (K263) within the cytoplasmic domain of PD-L1 is acetylated.
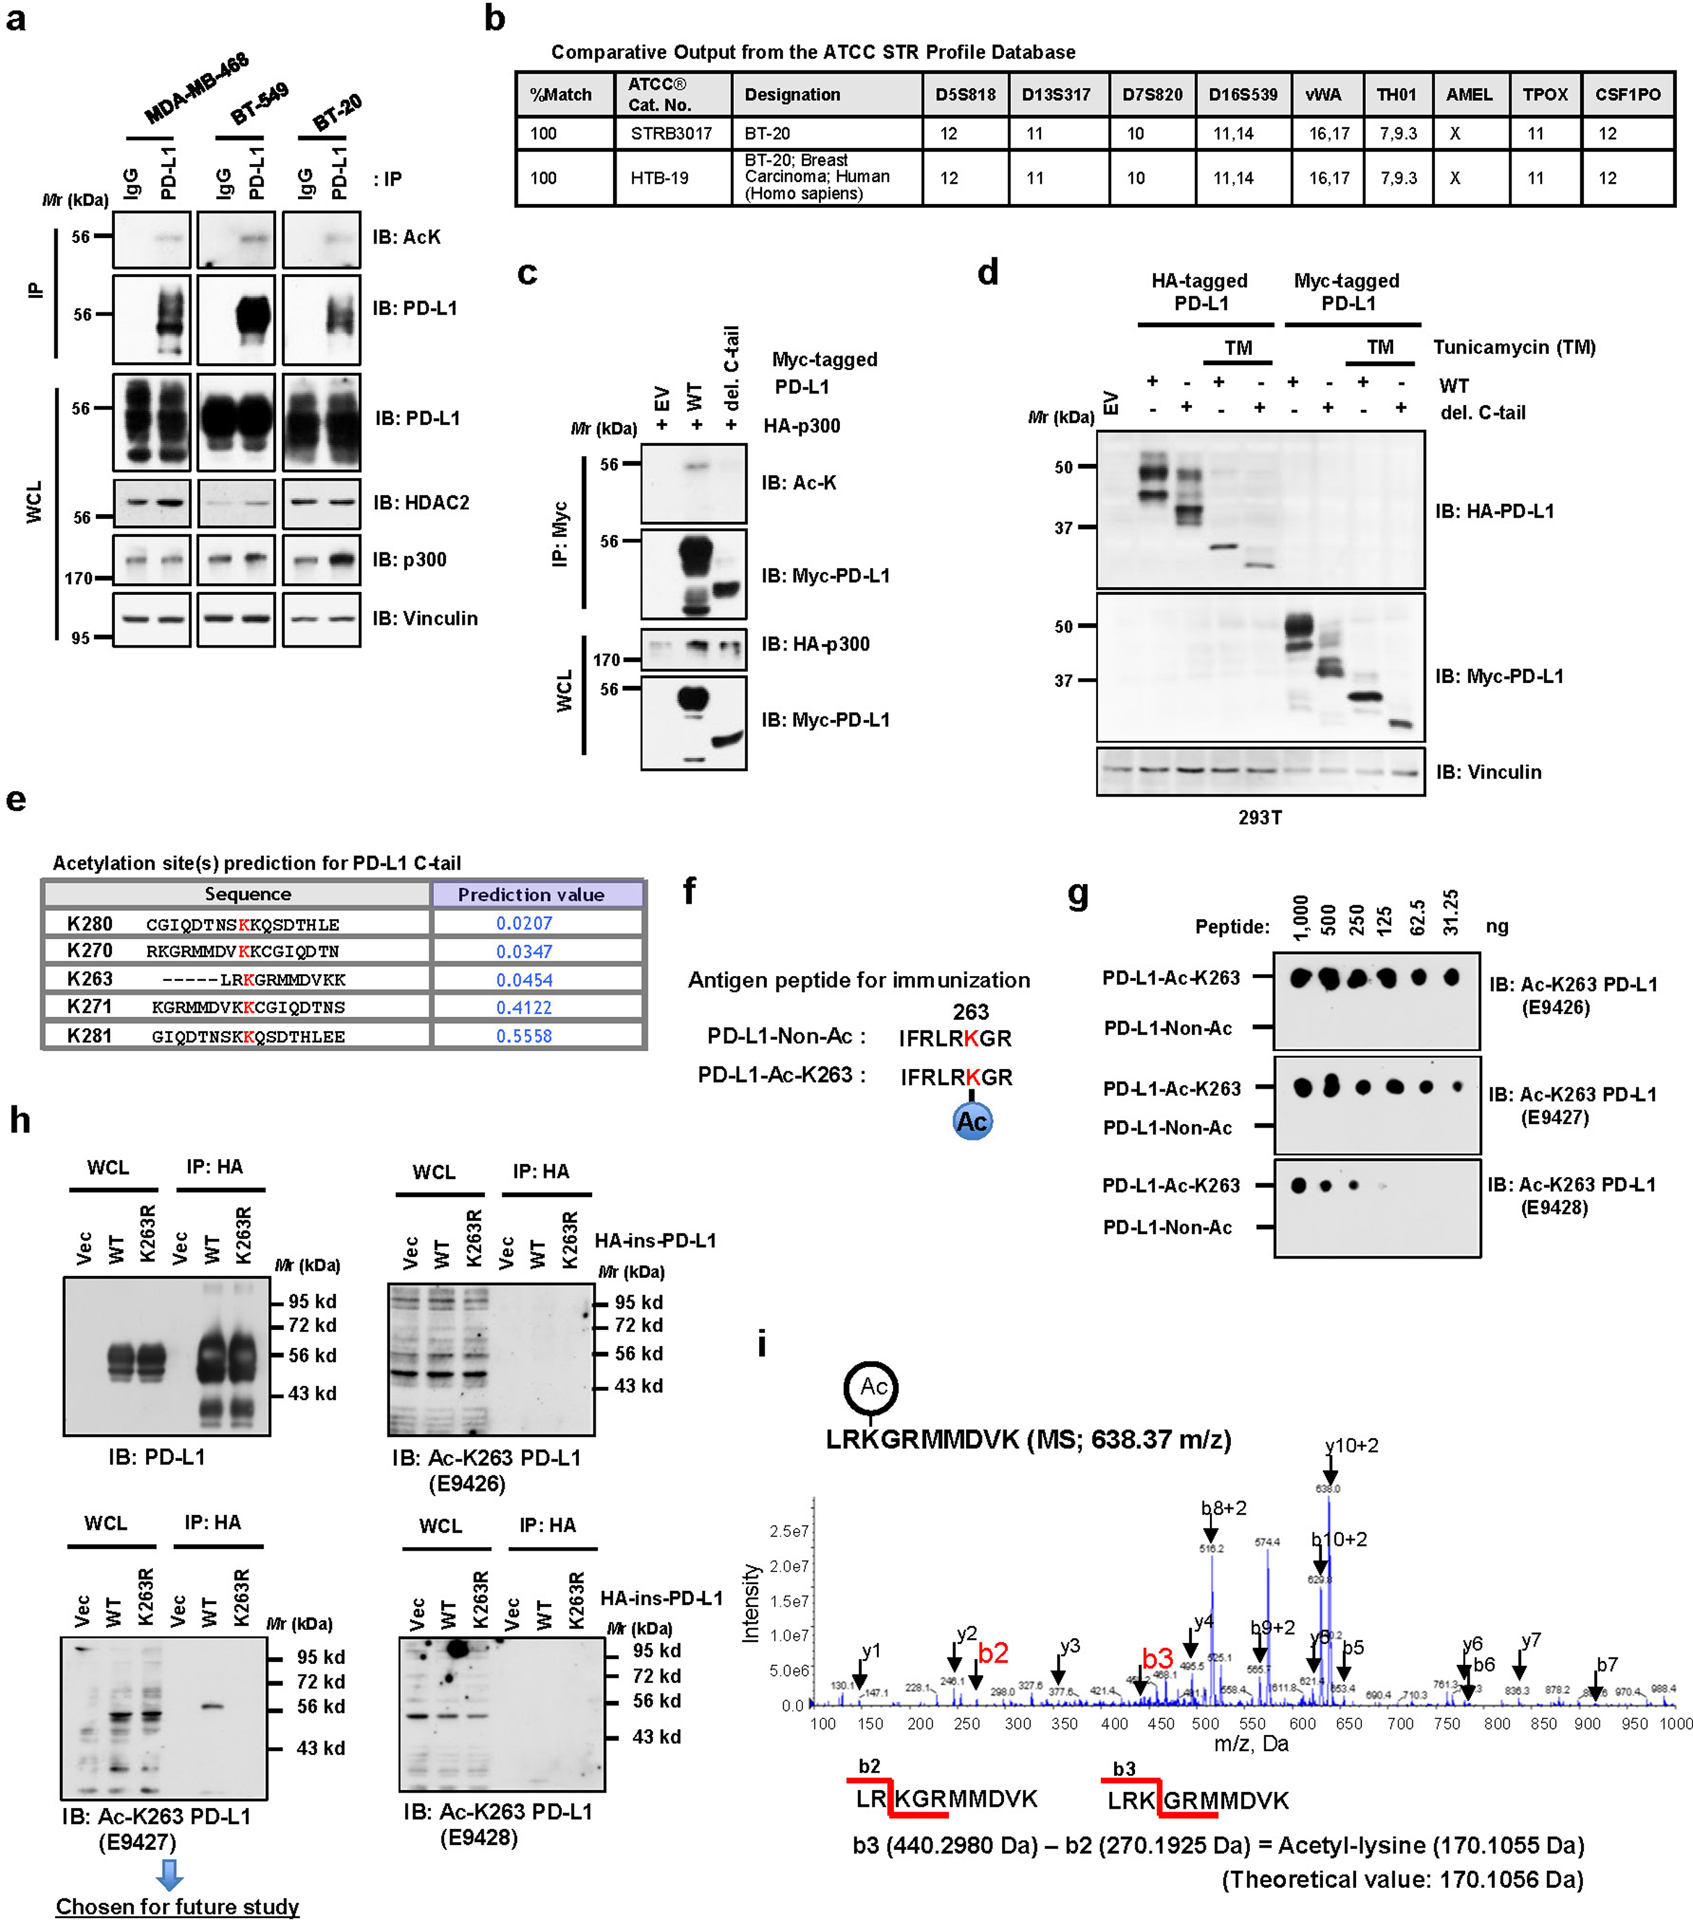
a, Immunoblot (IB) analysis of whole-cell lysates (WCL) and anti-PD-L1 immunoprecipitates (IPs) derived from MDA-MB-468, BT-549 and BT-20 cells. Immunoglobulin G (IgG) served as a negative control. b, Authentication results of the BT-20 cell line performed by ATCC. c, IB analysis of WCL and anti-Myc IPs derived from 293T cells transfected with HA-p300 and Myc-full length (FL) PD-L1 or the deletion mutant of C-tail (amino acids (AA) 263–290). d, IB analysis of WCL derived from 293T cells transfected with HA-tag-inserted (HA-ins) or Myc-tagged wild-type (WT) or del. C-tail PD-L1 with or without 1 μg/ml tunicamycin treatment overnight. e, Predicted lysine acetylation sites by the Web Server for KAT-specific Acetylation Site Prediction (ASEB) analysis. f, A schematic diagram of the PD-L1 Lys263 acetylated peptide and non-acetylated peptide used for immunization to generate the anti-Ac-K263 PD-L1 antibody. g, Dot-blot testing of acetylated and non-acetylated peptides using indicated purified antibodies. h, IB analysis of WCL and anti-HA IPs derived from 293T cells transfected with HA-ins-PD-L1 WT or the K263R mutant. i, Mass-spectrometry detection of Lys263 acetylation using a synthetic peptide (AA 261 to 270) following in vitro acetylation assay. The blots and western blots in a, c, d, g and h were performed for n=2 independent experiments with similar results. Unprocessed immunoblots are shown in Source Data Extended Data Fig. 1.
Extended Data Fig. 2. HDAC2 mediates deacetylation of PD-L1.
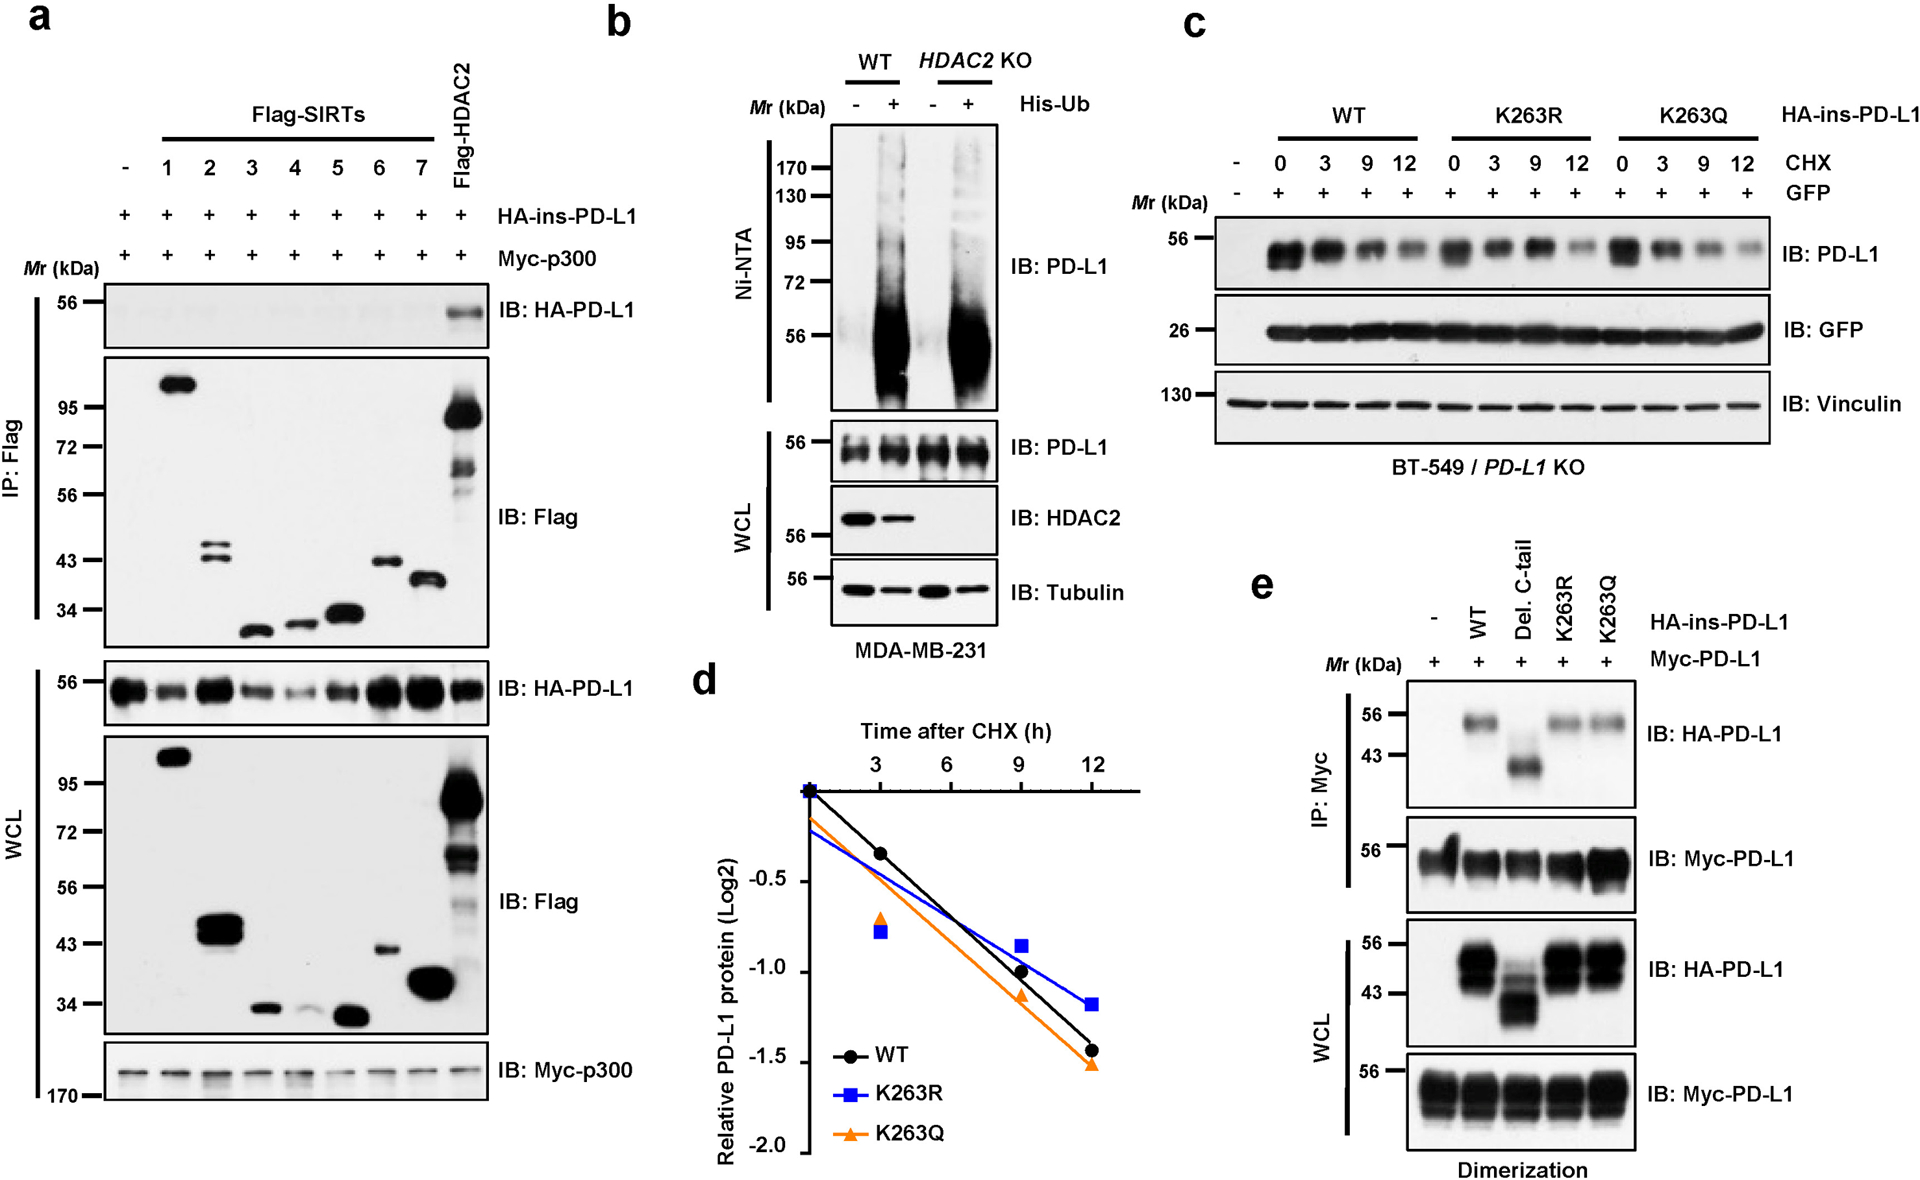
a, IB analysis of WCL and anti-Flag IPs derived from 293T cells transfected with Myc-p300, HA-ins-PD-L1 and/or Flag-tagged deacetylases. b, IB analysis of WCL and Ni-NTA pull-down products from MDA-MB-231 WT and HDAC2 knockout (KO) cells transfected with His-Ub and treated with 10 μM MG-132 overnight. c, d, IB analysis of WCL derived from BT-549 PD-L1 KO cells transfected with HA-PD-L1 WT, K263R or K263Q mutants and treated with 150 μg/ml cycloheximide (CHX) for indicated hours (c). Signal intensity of PD-L1 protein was quantified by ImageJ as indicated (d). e, IB analysis of WCL and anti-Myc IPs derived from 293T cells transfected with indicated constructs. Western blots in a-c and e were performed for n=2 independent experiments with similar results. Unprocessed immunoblots are shown in Source Data Extended Data Fig. 2.
Extended Data Fig. 3. Lysine 263 (K263) acetylation regulates PD-L1 nuclear translocation.
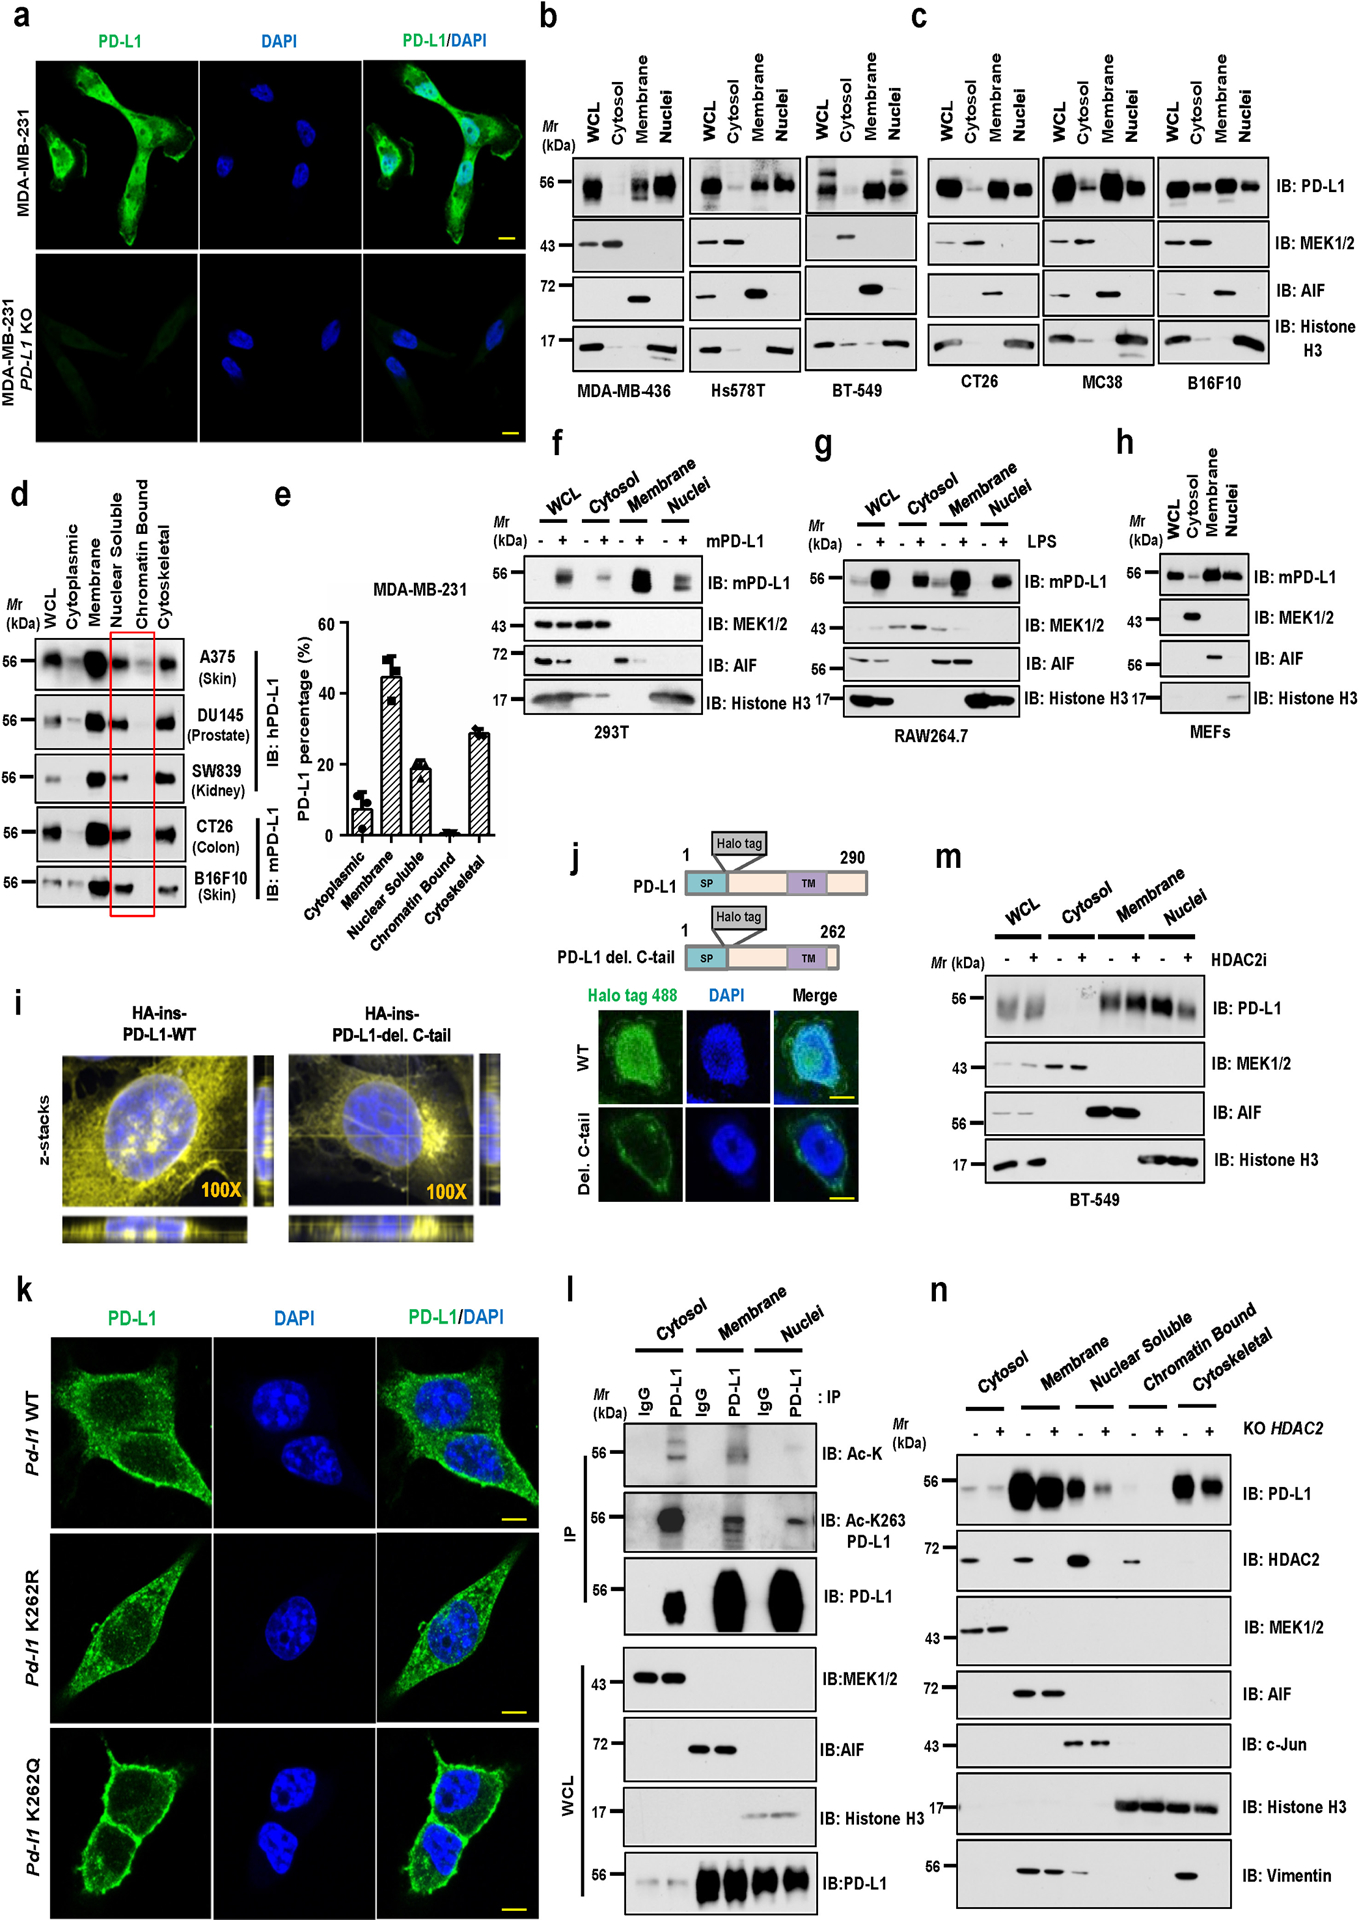
a, Immunofluorescence (IF) staining of human PD-L1 (clone 9A11) and DAPI of MDA-MB-231 WT and PD-L1 KO cells. Scale bars, 10 μm. b, c, Fractionation analysis using kit from Cell Signaling Technology (CST, #9038) for PD-L1 in human MDA-MB-436, Hs578T and BT-549 cells (b), as well as in mouse CT26, MC38, and B16F10 cells (c). d, Fractionation analysis using kits from Thermo Fisher Scientific™ (#78840) for PD-L1 in indicated cell lines. e Quantification of PD-L1 protein abundance of indicated compartments in MDA-MB-231 cells. Data were presented as mean ± s.d. (n=3 biologically independent samples). f, Fractionation analysis for PD-L1 from 293T cells transfected with mouse PD-L1. g, h, Fractionation analysis for PD-L1 in RAW264.7 cells stimulated with 1 μg/ml Lipopolysaccharide (LPS) for 16 hours (g) and in mouse embryonic fibroblasts (h). i, Z-stacks confocal microscopy images (3x close-up of the source picture) for IF study in Figure 3d. PD-L1, yellow color and DAPI, blue. j, Fluorescence images of MDA-MB-231 PD-L1 KO cells transduced with Halo-PD-L1 (AF488) or its C-tail deletion mutant. Scale bars, 5 μm. k, IF staining of mouse PD-L1 (clone 5C5) in CT26 Pd-l1 KO cells transduced with mouse Pd-l1 WT, K262R or K262Q mutant lentivirus. Scale bars, 5 μm. l, IB analysis of WCL and anti-PD-L1 IPs derived from indicated fractions of MDA-MB-231 cells. m, Fractionation analysis for BT-549 cells treated with 50 μM HDAC2 inhibitor for 6 hrs. n, Fractionation analysis for PD-L1 in MDA-MB-231 WT or HDAC2 KO cells. The Western blots in b-d, f-h, l-n, and IF studies in a, j and k were performed for n=2 independent experiments with similar results. Unprocessed immunoblots are shown in Source Data Extended Data Fig. 3.
Extended Data Fig. 4. Protein interacting network likely mediates PD-L1 nuclear translocation process.
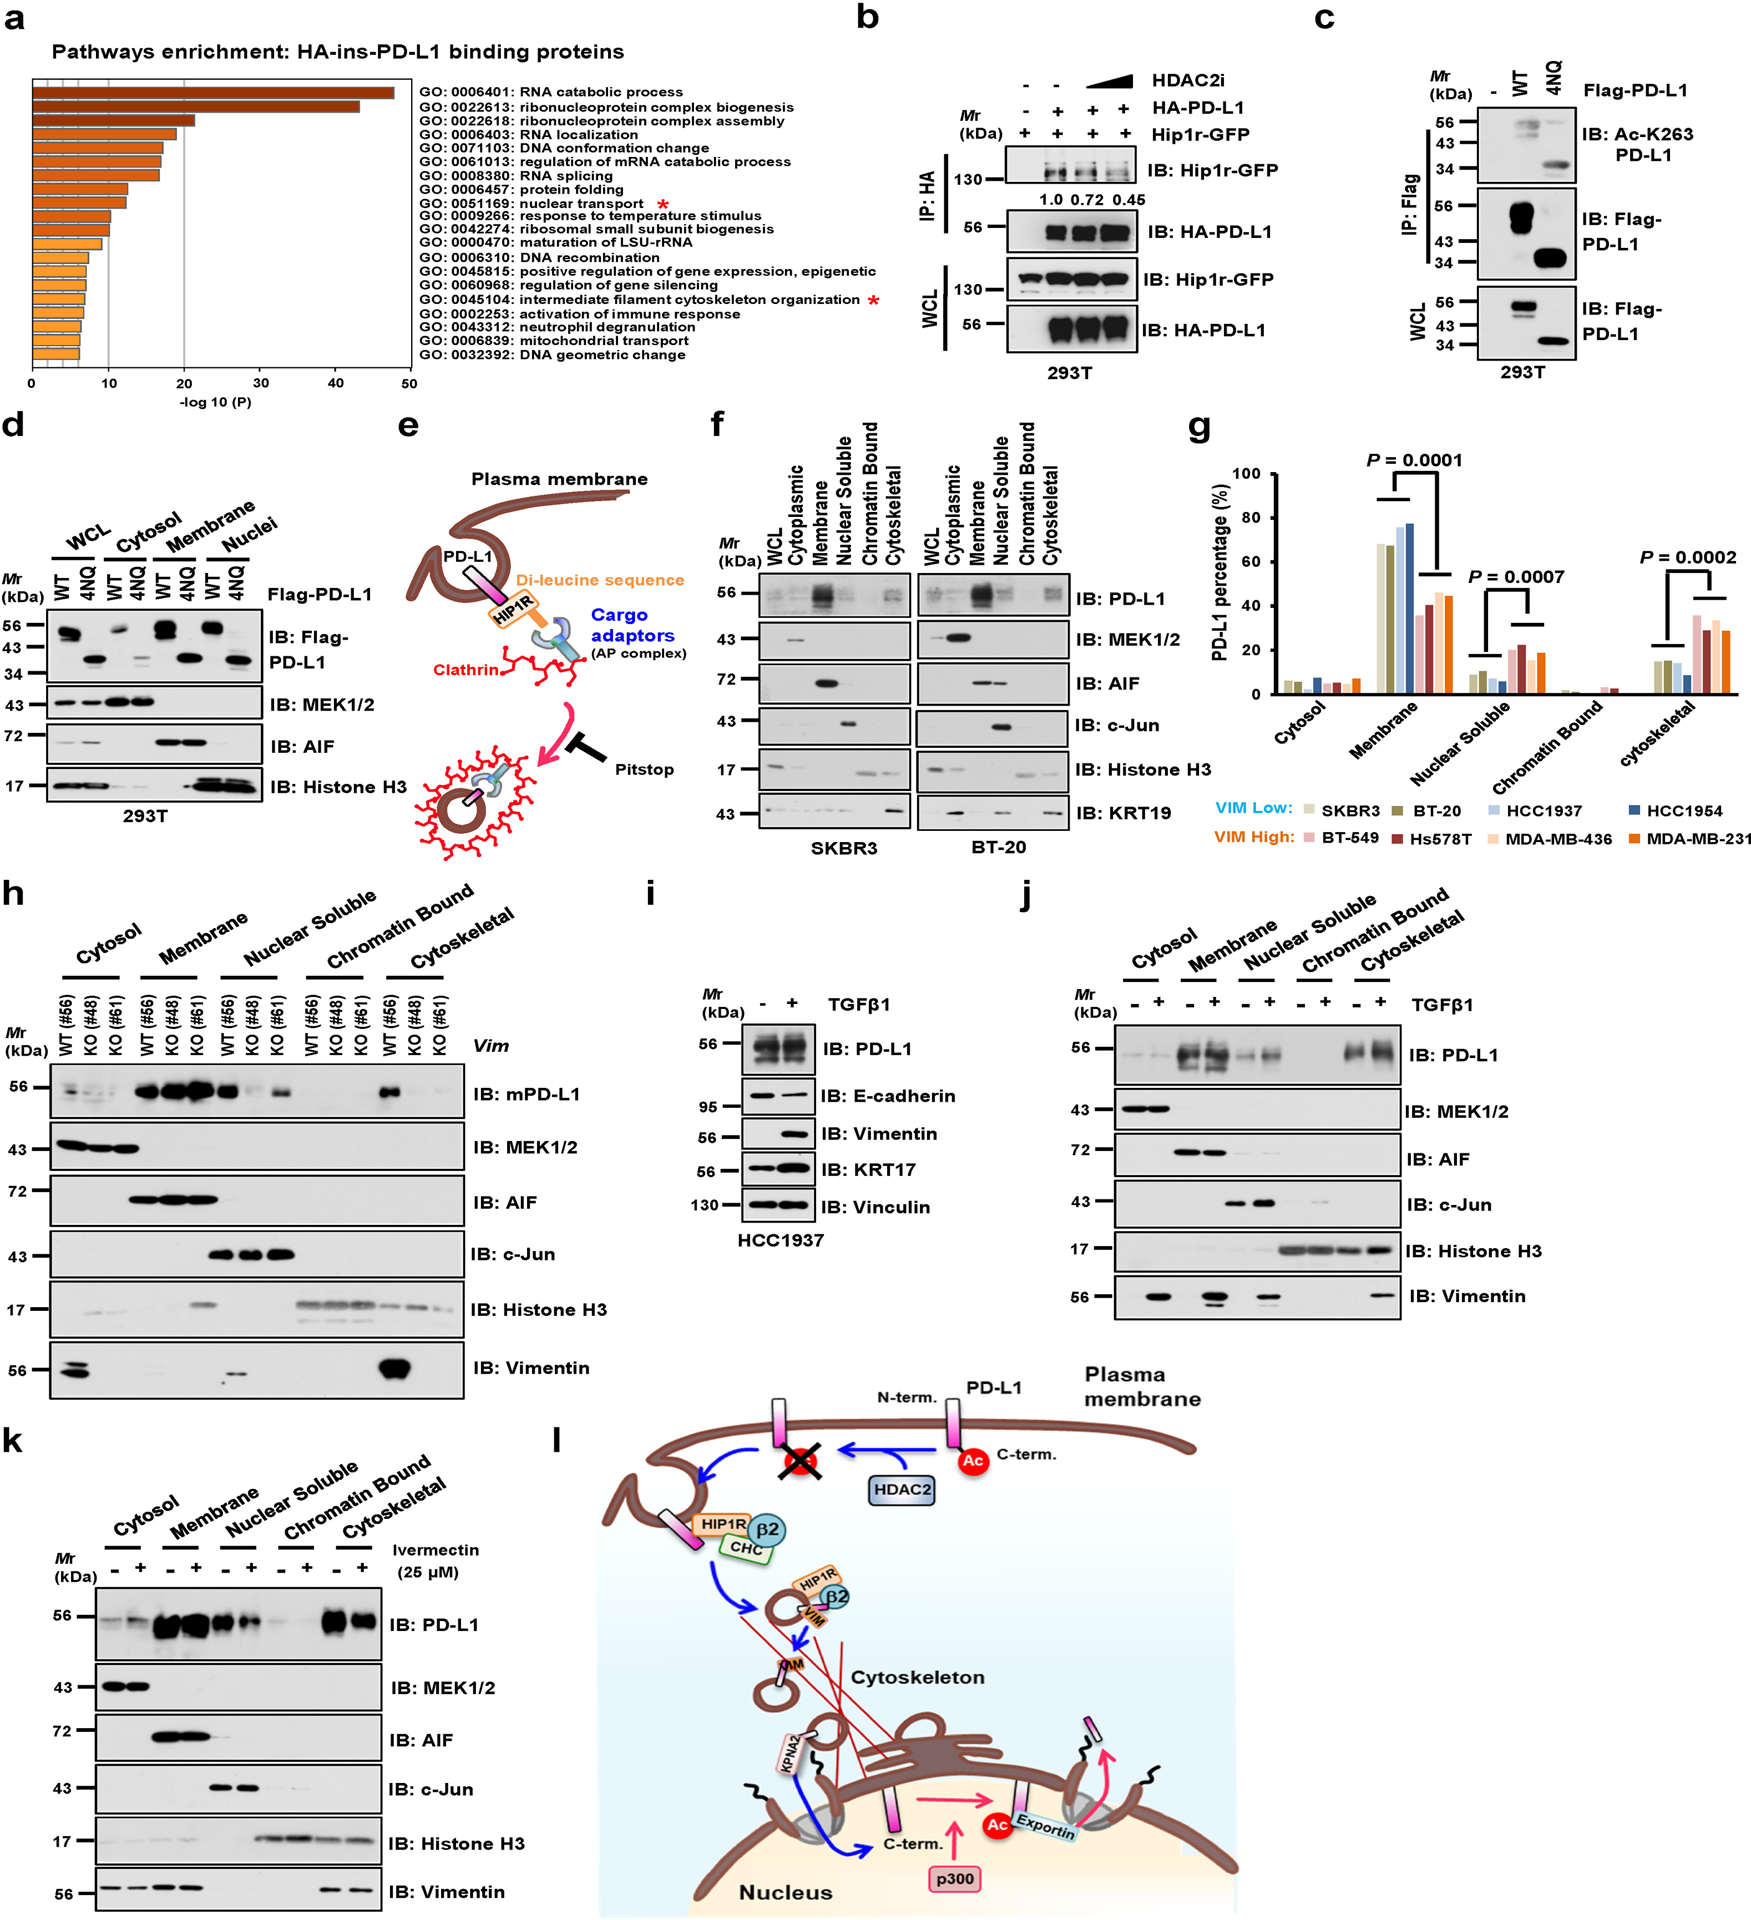
a, Results from mass spectrometry analysis were analyzed for GO term enrichment. Red stars denote pathways associated with protein translocation. n = 2 independent experiments with similar results. P values were calculated using hypergeometric test. b, IB of WCL and anti-HA IPs derived from 293T cells transfected with HA-ins-PD-L1 and mouse Hip1r-GFP, and treated with HDAC2 inhibitor for 6 hrs. c, IB of WCL and anti-Flag IPs derived from 293T cells transfected with PD-L1 WT or glycosylation-deficient 4NQ (N35, N192, N200 and N219) mutant. d, Fractionation analysis for PD-L1 from 293T cells transfected with WT or the glycosylation-deficient 4NQ mutant. e, Schematic diagram depicting the working model for endocytosis of PD-L1 from plasma membrane. f, Fractionation analysis for PD-L1 in Vimentin-low SKBR3 and BT-20 cells. g, Relative abundance of PD-L1 protein in each fraction was quantified and calculated for percentage. Statistics, two-tailed Student’s t-test. h, Fractionation analysis for PD-L1 in CT26 WT and Vim KO clones. i, IB of HCC1937 cells treated with 10 ng/ml Transforming Growth Factor-β1 (TGFβ1) for 14 days. j, Fractionation analysis for PD-L1 in HCC1937 cells treated with 10 ng/ml TGFβ1 for 14 days. k, Fractionation analysis for PD-L1 in MDA-MB-231 cells treated with vehicle or 25 μM Ivermectin (IVM) for 2 hrs. l, A schematic diagram to show the working model for nuclear translocation of PD-L1 from plasma membrane. Western blots in b-d, f, and h-k were performed for n=2 independent experiments with similar results. Unprocessed immunoblots are shown in Source Data Extended Data Fig. 4. Statistical source data are available in Statistical Source Data Extended Data Fig. 4.
Extended Data Fig. 5. Nuclear PD-L1 likely stimulates the gene expression of pro-inflammation pathways.
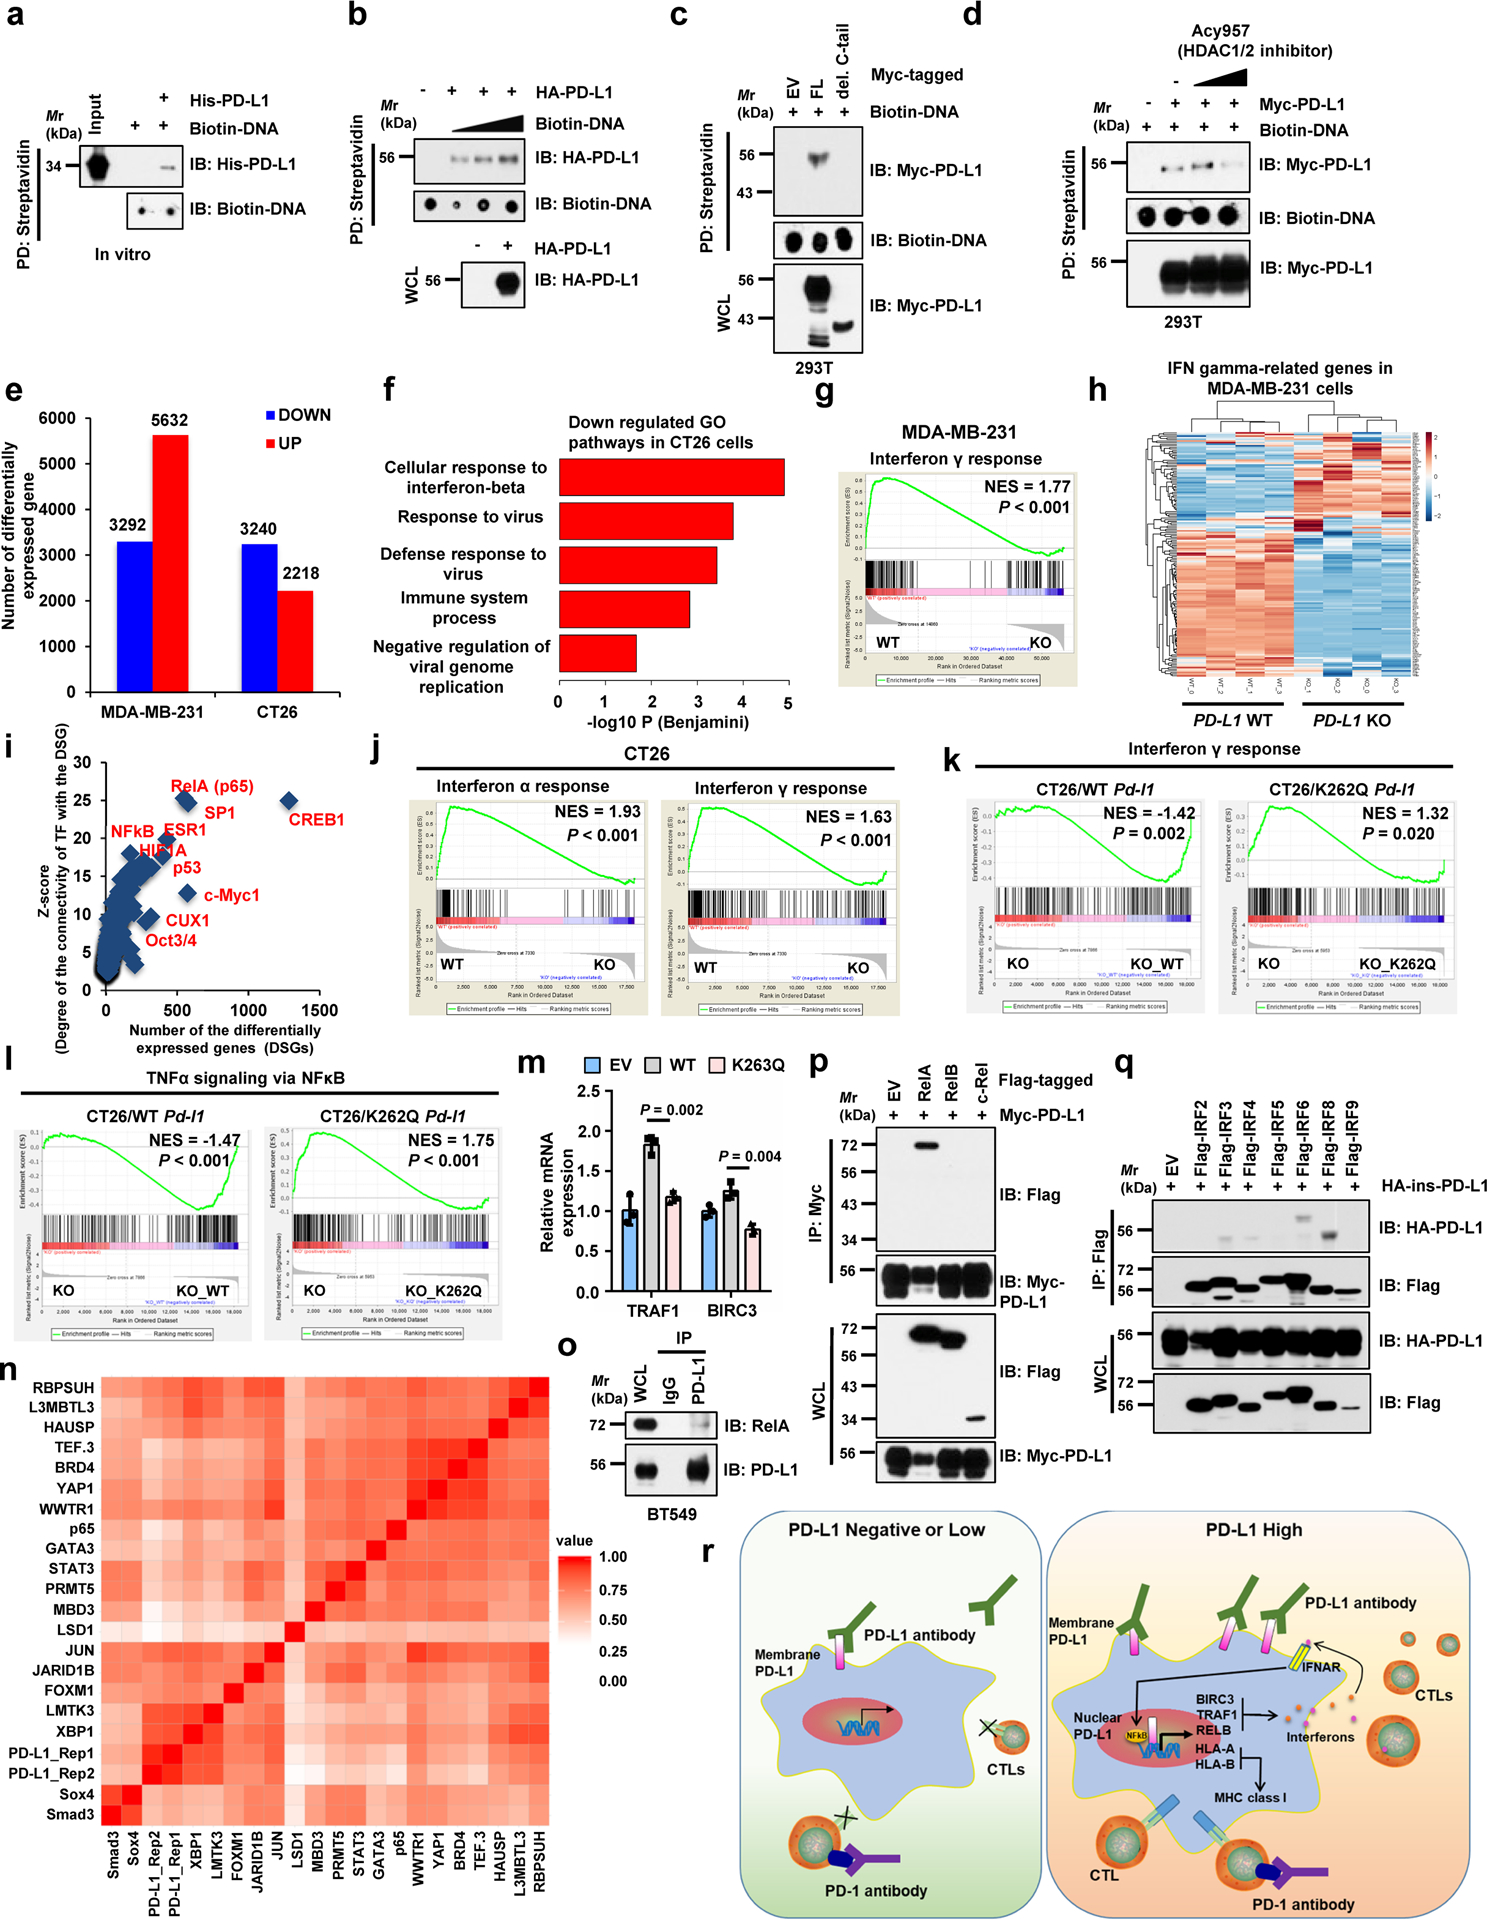
a, DNA binding assays of purified PD-L1 with biotinylated DNA in vitro. b, c, DNA binding assays of biotinylated DNA and 293T cells transfected with indicated constructs. d, DNA biding assays of transfected 293T cells treated with Acy957. e, Numbers of differentially expressed genes upon PD-L1 KO. f, Top 5 enriched immune response-related GO terms upon Pd-l1 KO in CT26 cells, analyzed by Fisher-exact test with Benjamini-Hochberg correction. g, GSEA signature upon PD-L1 KO in MDA-MB-231 cells. h, Heatmap display of interferon γ genes upon PD-L1 KO in MDA-MB-231 cells. i, Prediction analysis for transcription factors regulating down-regulated genes upon PD-L1 KO in MDA-MB-231 cells. j, GSEA signatures upon Pd-l1 KO in CT26 cells. k, l, GSEA signatures of pathways in CT26 Pd-l1 KO cells restored WT or K262Q mutant Pd-l1. m, qRT-PCR analysis of BT-549 PD-L1 KO cells transfected with PD-L1 WT or K263Q mutants. Data are shown as mean ± s.d. of n=3 independent experiments. Statistics, two-tailed Student’s t-test. n. Hierarchical clustering of ChIP-seq binding profiles and two replicates of PD-L1 binding profiles genome-wide in MDA-MB-231 cells. o. IB of WCL and anti-PD-L1 IPs derived from MDA-MB-231 cells. p, q, IB of WCL and IPs derived from 293T cells transfected with indicated constructs. r, Schematic diagram showing how nuclear PD-L1 enhances the immunotherapy response through affecting expression of immune-related genes. GSEA analyses in g and j-l were performed using Kolmogorov-Smirnov statistic. Biologically independent sequenced samples/group for f-j, n=4; for k and l, n=3. The blots and Western blots in a-d and o-q were performed for n=2 independent experiments with similar results. Unprocessed immunoblots are shown in Source Data Extended Data Fig. 5. Statistical source data are available in Statistical Source Data Extended Data Fig. 5.
Extended Data Fig. 6. PD-L1 expression levels correlate with and regulate immune-checkpoint genes.
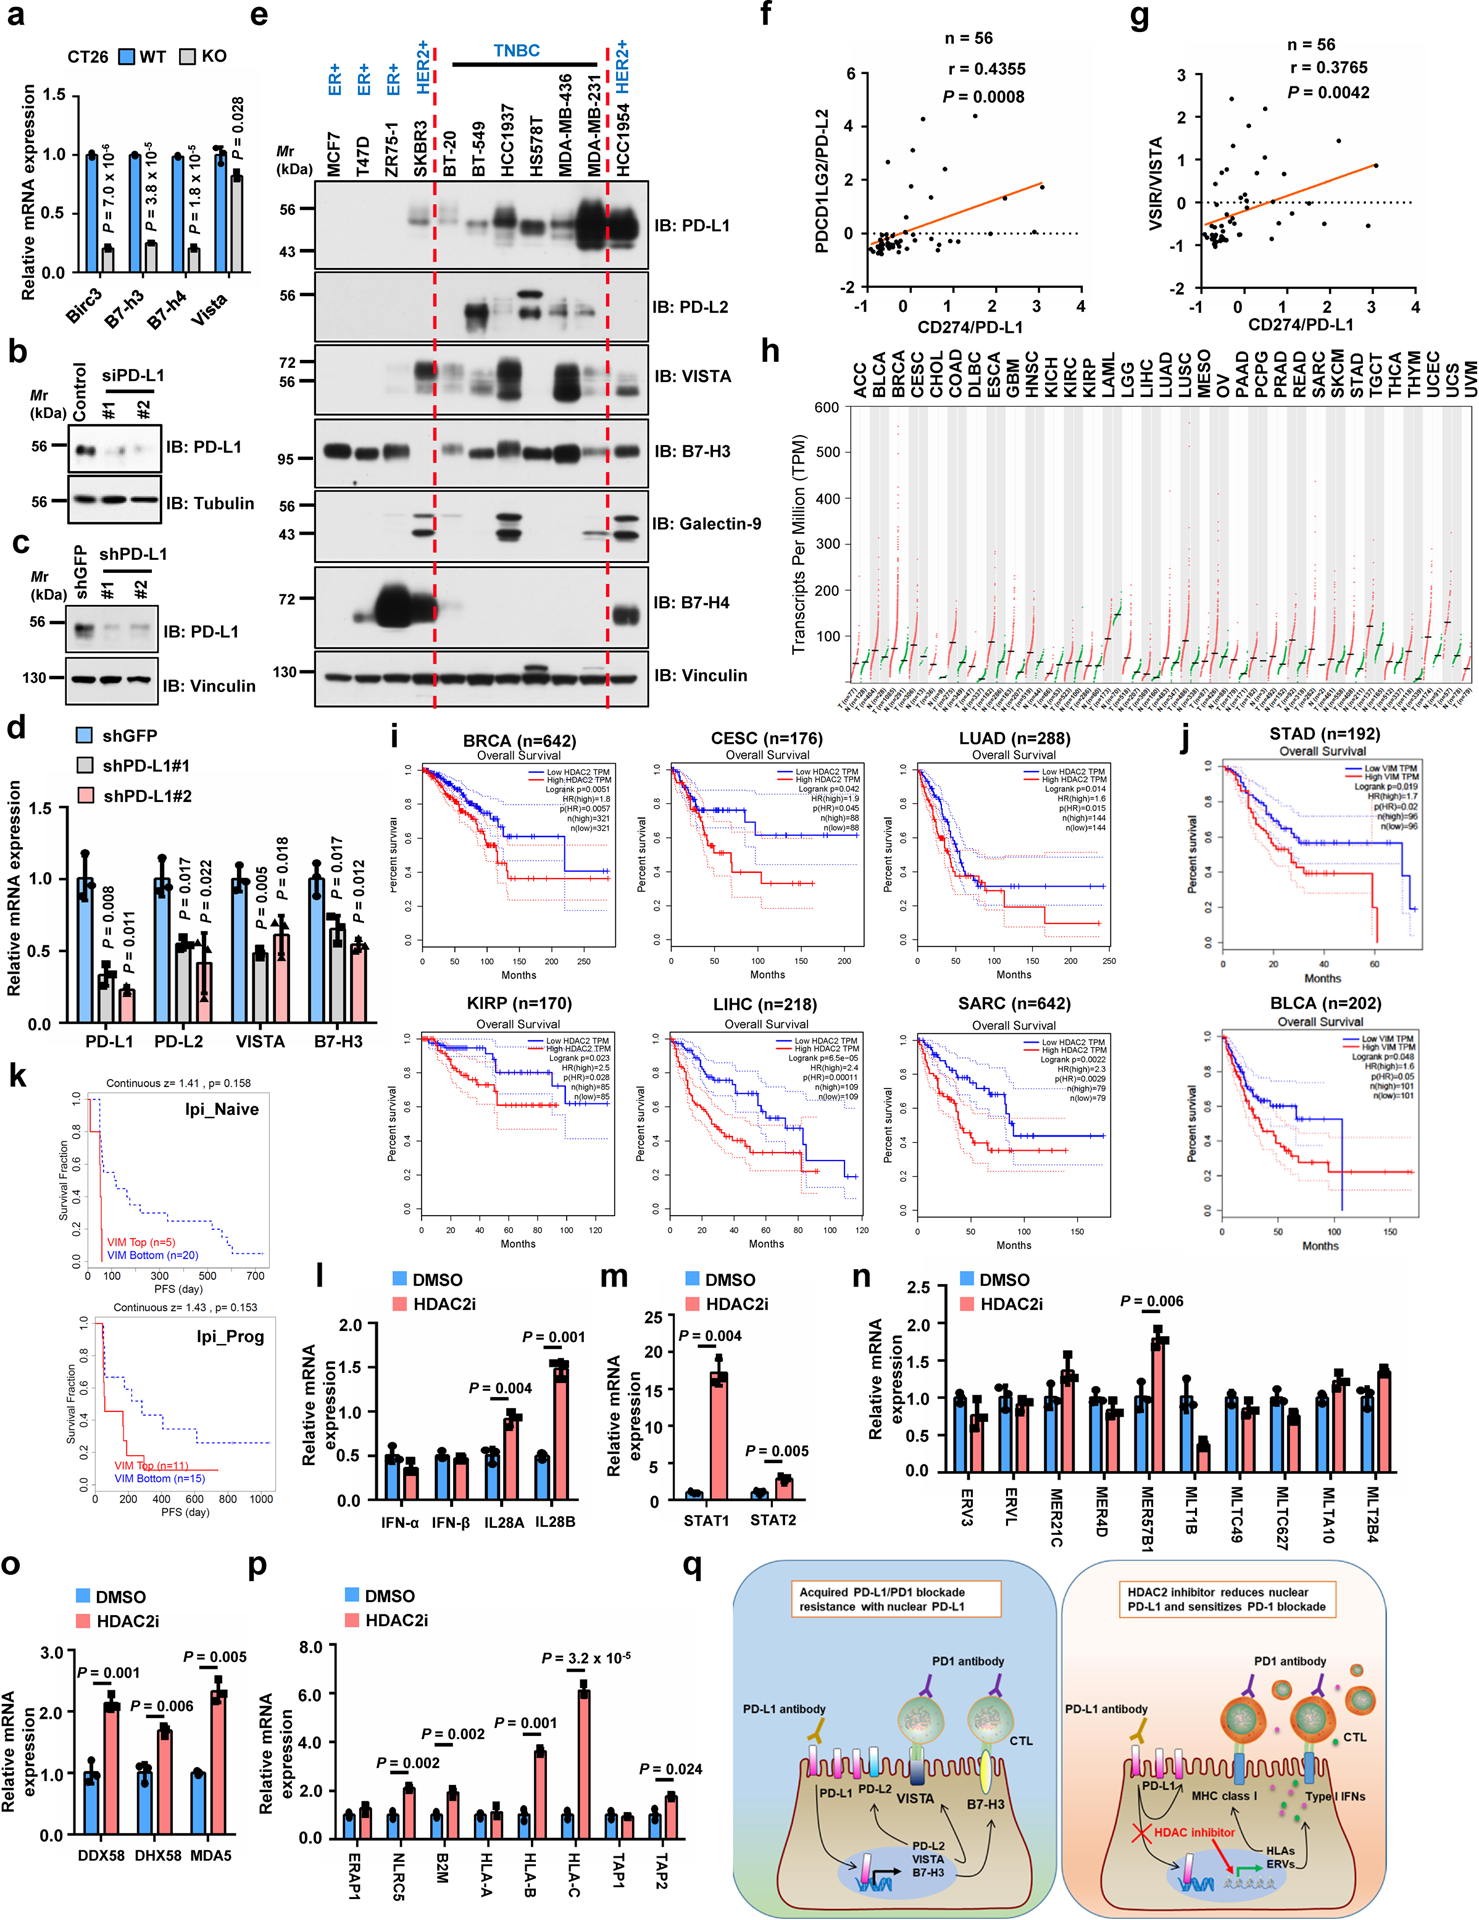
a, qRT-PCR analysis of genes upon Pd-l1 KO in CT26 cells. b, IB of MDA-MB-231 cells transfected with control or PD-L1 siRNAs. c, d, IB (c) and qRT-PCR (d) analysis of MDA-MB-231 cells with PD-L1 knockdown by shRNAs. e, IB of WCL derived from breast cancer cell lines. f, g, Pearson correlation (two-tailed) analysis for PD-L1 mRNA (Z-score) with PD-L2 (f) or VISTA (g) in breast cancer cell lines (GSE36139). Red line, linear regression line. h, HDAC2 expression profiled by GEPIA. Tumour (T), red dots; normal tissues (N), green dots. i, Overall survival of patients with high (>70%, red curve) and low (<30%, blue curve) HDAC2 (i) or Vimentin (j) analyzed using Log-rank test by GEPIA. k, Progression-free survival (PFS) of melanoma patients (Riaz2017_PD1 cohort, PMID:29033130) treated with PD-1 mAb (Nivolumab) with high or low VIM expression analyzed using Kaplan-Meier curves by TIDE. Ipi_Naive, ipilimumab-naïve (n=25); Ipi_Prog, progressed on ipilimumab (n=26). l-p, qRT-PCR of MDA-MB-231 cells treated with vehicle or HDAC2 inhibitor. These genes are involved in Type I or III interferon pathways (l), STAT1/2 pathways (m), endogenous retrovirus ERVs (n), double-stranded pattern recognition receptors (o), antigen presenting and presentation via MHC class I (p). q, Schematic diagram to show a possible molecular mechanism of acquired PD-L1/PD-1 blockade resistance caused by nuclear PD-L1 (left), and the potential usage of HDAC2 inhibitor (right). Tumor abbreviations are shown in GEPIA. Western blots b-c and e were performed for n=2 independent experiments with similar results. PCR data a, d and l-p were shown as mean ± s.d. of n=3 independent experiments, analyzed by two-tailed Student’s t-test. Unprocessed immunoblots are shown in Source Data Extended Data Fig. 6. Statistical source data are available in Statistical Source Data Extended Data Fig. 6.
Extended Data Fig. 7. Targeting HDAC2 and inhibiting PD-L1 deacetylation can enhance immunotherapy efficacy.
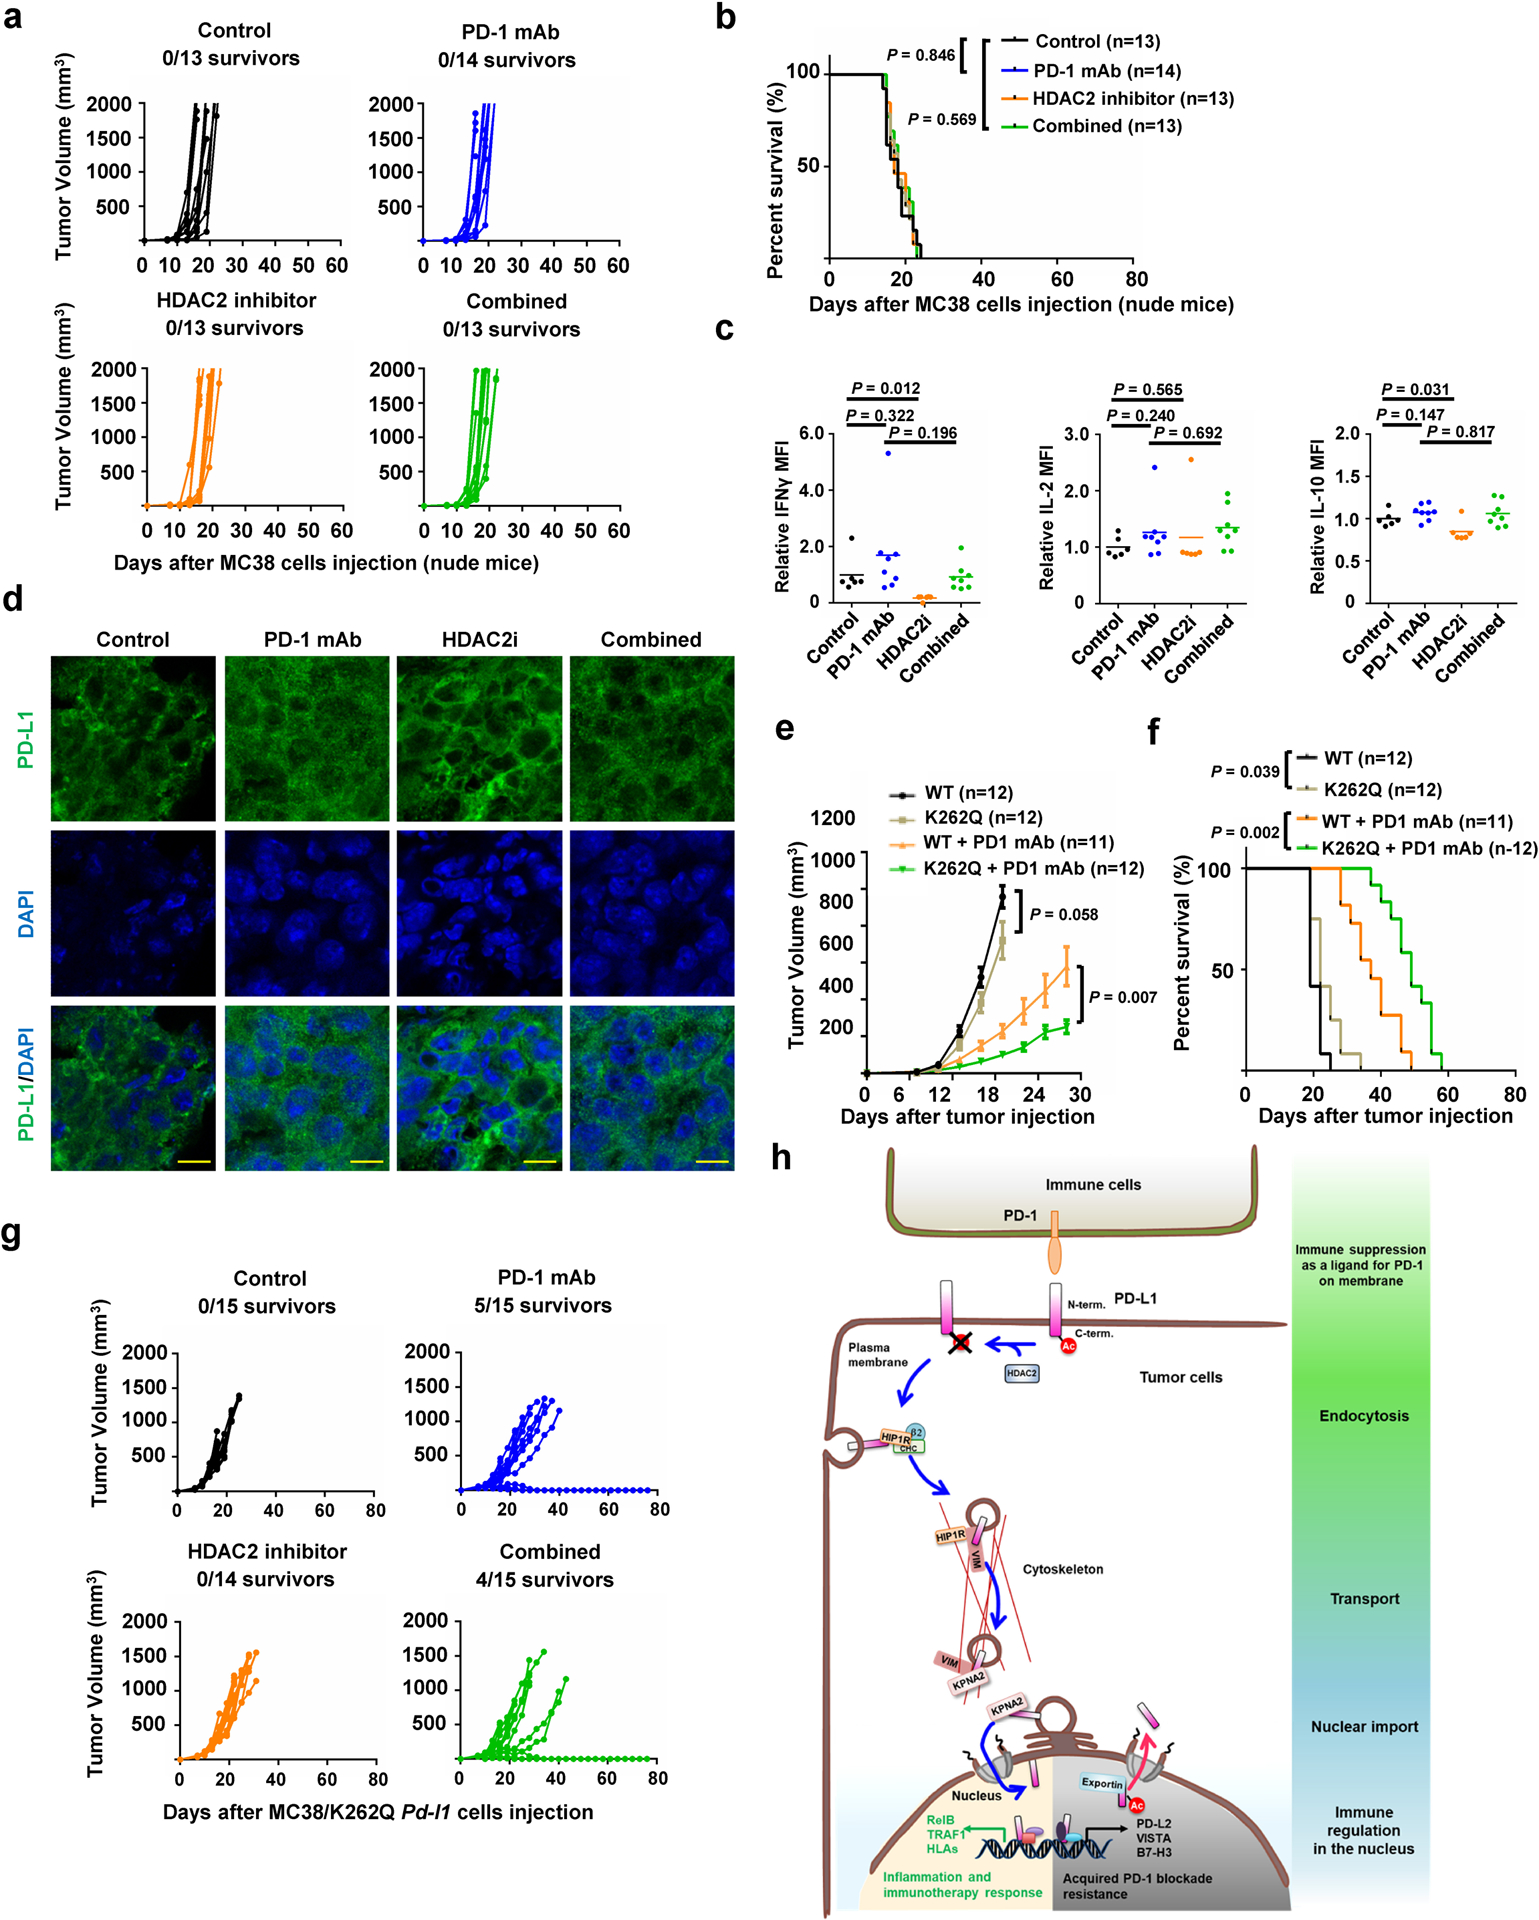
a, b, Tumour growth (a) and survival curves (b) of nude mice bearing MC 38 tumors treated with control antibody, PD-1 mAb, HDAC2 inhibitor or combined therapy. c, TILs from treated MC38 syngeneic tumours (Control, n=6; PD-1 mAb, n=8; HDAC2i, n=6; Combined, n=8) after stimulation were analyzed for Interferon γ (IFNγ), IL-2 and IL-10. d, Immunofluorescence for PD-L1 and DAPI of MC38 syngeneic tumours treated as indicated. Scale bars, 10 μm. n=4 independent samples per group. e, f, Tumour growth (e) and survival curves (f) of BALB/c mice bearing tumor derived from CT26-Pd-l1 KO cells with re-introduced WT or K262Q Pd-l1, treated with control antibody or PD-1 mAb. Tumour volume was shown as mean ± s.d. Statistics in e, two-tailed Student’s t-test. g, Tumour growth of MC38/K262Q Pd-l1 tumour-bearing C57BL/6 mice treated as indicated. h, A schematic diagram of molecular mechanism underling nuclear translocation of PD-L1 and its contradictory functions in immune response. PD-L1 deacetylated by HDAC2 is translocated into the nucleus via interacting with various key regulatory proteins for endocytosis and nuclear translocation, then transactivates immune responsive in the nucleus to impact tumour sensitivity to PD-1 blockage (the lower left panel with yellow background), as well as controlling various immune checkpoint gene expression to possibly confer resistance to PD-1 blockage treatment (the lower right panel with gray background). Thus, HDAC2 inhibitor will reduce PD-L1 nuclear localization to prevent the emerging resistance to PD-1 blockade treatment. P values in b and f were calculated using Gehan-Breslow-Wilcoxo test, two-sided. Statistical source data are available in Statistical Source Data Extended Data Fig. 7.
Acknowledgments
We thank J. Guo, F. Dang and other Wei lab members for critical reading of the manuscript, as well as members of Dr. Wei, Dr. Freeman and Dr. Sicinski laboratories for helpful discussions. We thank Microscopy Resources on the North Quad (MicRoN) core at Harvard Medical School for helping on IF experiments. This work was supported in part by the NIH grants (R01CA177910 and R01GM094777 to W.W.; P50CA101942 to G.J.F; R01CA236226 and R01CA202634 to P.S.; and R01CA236356 to W.X.); Japan Society for Promotion of Science (JSPS) KAKENHI Grant (JP18H06157) to N.T.N. N.T.N. is supported by JSPS Research Fellowships for Young Scientists and the Osamu Hayaishi Memorial Scholarship for Study Abroad.
Footnotes
Competing interests
G.J.F. has patents/pending royalties on the PD-1 pathway from Roche, Merck, Bristol-Myers-Squibb, EMD-Serono, Boehringer-Ingelheim, AstraZeneca, Leica, Mayo Clinic, Dako and Novartis. G.J.F. has served on advisory boards for Roche, Bristol-Myers-Squibb, Xios, Origimed, Triursus, iTeos, NextPoint, IgM, and Jubilant. P.S. has been a consultant at Novartis, Genovis, Guidepoint, The Planning Shop, ORIC Pharmaceuticals, Syros and Exo Therapeutics; his laboratory receives research funding from Novartis. W.W. is a co-founder and consultant for the ReKindle Therapeutics. Other authors declare no competing financial interests.
Reference:
- 1.Chen DS & Mellman I Elements of cancer immunity and the cancer-immune set point. Nature 541, 321–330 (2017). [DOI] [PubMed] [Google Scholar]
- 2.Baumeister SH, Freeman GJ, Dranoff G & Sharpe AH Coinhibitory Pathways in Immunotherapy for Cancer. Annu Rev Immunol 34, 539–573 (2016). [DOI] [PubMed] [Google Scholar]
- 3.Ribas A & Wolchok JD Cancer immunotherapy using checkpoint blockade. Science 359, 1350–1355 (2018). [DOI] [PMC free article] [PubMed] [Google Scholar]
- 4.Sharma P, Hu-Lieskovan S, Wargo JA & Ribas A Primary, Adaptive, and Acquired Resistance to Cancer Immunotherapy. Cell 168, 707–723 (2017). [DOI] [PMC free article] [PubMed] [Google Scholar]
- 5.Restifo NP, Smyth MJ & Snyder A Acquired resistance to immunotherapy and future challenges. Nat Rev Cancer 16, 121–126 (2016). [DOI] [PMC free article] [PubMed] [Google Scholar]
- 6.Zhang J et al. Cyclin D-CDK4 kinase destabilizes PD-L1 via cullin 3-SPOP to control cancer immune surveillance. Nature 553, 91–95 (2018). [DOI] [PMC free article] [PubMed] [Google Scholar]
- 7.Lim SO et al. Deubiquitination and Stabilization of PD-L1 by CSN5. Cancer Cell 30, 925–939 (2016). [DOI] [PMC free article] [PubMed] [Google Scholar]
- 8.Zhang J, Dang F, Ren J & Wei W Biochemical Aspects of PD-L1 Regulation in Cancer Immunotherapy. Trends Biochem Sci 43, 1014–1032 (2018). [DOI] [PubMed] [Google Scholar]
- 9.Galluzzi L, Chan TA, Kroemer G, Wolchok JD & Lopez-Soto A The hallmarks of successful anticancer immunotherapy. Sci Transl Med 10 (2018). [DOI] [PubMed] [Google Scholar]
- 10.Ansell SM et al. PD-1 blockade with nivolumab in relapsed or refractory Hodgkin’s lymphoma. N Engl J Med 372, 311–319 (2015). [DOI] [PMC free article] [PubMed] [Google Scholar]
- 11.Inuzuka H et al. Acetylation-dependent regulation of Skp2 function. Cell 150, 179–193 (2012). [DOI] [PMC free article] [PubMed] [Google Scholar]
- 12.Nihira NT et al. Acetylation-dependent regulation of MDM2 E3 ligase activity dictates its oncogenic function. Sci Signal 10 (2017). [DOI] [PMC free article] [PubMed] [Google Scholar]
- 13.Song H et al. Acetylation of EGF receptor contributes to tumor cell resistance to histone deacetylase inhibitors. Biochem Biophys Res Commun 404, 68–73 (2011). [DOI] [PMC free article] [PubMed] [Google Scholar]
- 14.Lin SY et al. Nuclear localization of EGF receptor and its potential new role as a transcription factor. Nat Cell Biol 3, 802–808 (2001). [DOI] [PubMed] [Google Scholar]
- 15.Gao YS, Hubbert CC & Yao TP The microtubule-associated histone deacetylase 6 (HDAC6) regulates epidermal growth factor receptor (EGFR) endocytic trafficking and degradation. J Biol Chem 285, 11219–11226 (2010). [DOI] [PMC free article] [PubMed] [Google Scholar]
- 16.Li CW et al. Glycosylation and stabilization of programmed death ligand-1 suppresses T-cell activity. Nat Commun 7, 12632 (2016). [DOI] [PMC free article] [PubMed] [Google Scholar]
- 17.Mezzadra R et al. Identification of CMTM6 and CMTM4 as PD-L1 protein regulators. Nature 549, 106–110 (2017). [DOI] [PMC free article] [PubMed] [Google Scholar]
- 18.Horita H, Law A, Hong S & Middleton K Identifying Regulatory Posttranslational Modifications of PD-L1: A Focus on Monoubiquitinaton. Neoplasia 19, 346–353 (2017). [DOI] [PMC free article] [PubMed] [Google Scholar]
- 19.Lasko LM et al. Discovery of a selective catalytic p300/CBP inhibitor that targets lineage-specific tumours. Nature 550, 128–132 (2017). [DOI] [PMC free article] [PubMed] [Google Scholar]
- 20.Glozak MA, Sengupta N, Zhang X & Seto E Acetylation and deacetylation of non-histone proteins. Gene 363, 15–23 (2005). [DOI] [PubMed] [Google Scholar]
- 21.Pavlik CM et al. Santacruzamate A, a potent and selective histone deacetylase inhibitor from the Panamanian marine cyanobacterium cf. Symploca sp. J Nat Prod 76, 2026–2033 (2013). [DOI] [PMC free article] [PubMed] [Google Scholar]
- 22.von Kleist L et al. Role of the clathrin terminal domain in regulating coated pit dynamics revealed by small molecule inhibition. Cell 146, 471–484 (2011). [DOI] [PubMed] [Google Scholar]
- 23.Schnitzer JE, Oh P, Pinney E & Allard J Filipin-sensitive caveolae-mediated transport in endothelium: reduced transcytosis, scavenger endocytosis, and capillary permeability of select macromolecules. The Journal of cell biology 127, 1217–1232 (1994). [DOI] [PMC free article] [PubMed] [Google Scholar]
- 24.McMahon HT & Boucrot E Molecular mechanism and physiological functions of clathrin-mediated endocytosis. Nature reviews. Molecular cell biology 12, 517–533 (2011). [DOI] [PubMed] [Google Scholar]
- 25.Bonifacino JS & Traub LM Signals for sorting of transmembrane proteins to endosomes and lysosomes. Annu Rev Biochem 72, 395–447 (2003). [DOI] [PubMed] [Google Scholar]
- 26.Wang H et al. HIP1R targets PD-L1 to lysosomal degradation to alter T cell-mediated cytotoxicity. Nat Chem Biol 15, 42–50 (2019). [DOI] [PubMed] [Google Scholar]
- 27.Paczkowski JE, Richardson BC & Fromme JC Cargo adaptors: structures illuminate mechanisms regulating vesicle biogenesis. Trends in cell biology 25, 408–416 (2015). [DOI] [PMC free article] [PubMed] [Google Scholar]
- 28.Mattera R, Boehm M, Chaudhuri R, Prabhu Y & Bonifacino JS Conservation and diversification of dileucine signal recognition by adaptor protein (AP) complex variants. J Biol Chem 286, 2022–2030 (2011). [DOI] [PMC free article] [PubMed] [Google Scholar]
- 29.Fazal F, Minhajuddin M, Bijli KM, McGrath JL & Rahman A Evidence for actin cytoskeleton-dependent and -independent pathways for RelA/p65 nuclear translocation in endothelial cells. J Biol Chem 282, 3940–3950 (2007). [DOI] [PubMed] [Google Scholar]
- 30.Cortes-Reynosa P, Robledo T & Salazar EP Epidermal growth factor promotes epidermal growth factor receptor nuclear accumulation by a pathway dependent on cytoskeleton integrity in human breast cancer cells. Arch Med Res 40, 331–338 (2009). [DOI] [PubMed] [Google Scholar]
- 31.Elosegui-Artola A et al. Force Triggers YAP Nuclear Entry by Regulating Transport across Nuclear Pores. Cell 171, 1397–1410 e1314 (2017). [DOI] [PubMed] [Google Scholar]
- 32.Satelli A et al. Potential role of nuclear PD-L1 expression in cell-surface vimentin positive circulating tumor cells as a prognostic marker in cancer patients. Sci Rep 6, 28910 (2016). [DOI] [PMC free article] [PubMed] [Google Scholar]
- 33.Yu Y et al. Cancer-associated fibroblasts induce epithelial-mesenchymal transition of breast cancer cells through paracrine TGF-beta signalling. Br J Cancer 110, 724–732 (2014). [DOI] [PMC free article] [PubMed] [Google Scholar]
- 34.Goldfarb DS, Corbett AH, Mason DA, Harreman MT & Adam SA Importin alpha: a multipurpose nuclear-transport receptor. Trends in cell biology 14, 505–514 (2004). [DOI] [PubMed] [Google Scholar]
- 35.Wagstaff KM, Sivakumaran H, Heaton SM, Harrich D & Jans DA Ivermectin is a specific inhibitor of importin alpha/beta-mediated nuclear import able to inhibit replication of HIV-1 and dengue virus. Biochem J 443, 851–856 (2012). [DOI] [PMC free article] [PubMed] [Google Scholar]
- 36.Isokane M et al. Plasma-membrane-anchored growth factor pro-amphiregulin binds A-type lamin and regulates global transcription. J Cell Sci 121, 3608–3618 (2008). [DOI] [PubMed] [Google Scholar]
- 37.Hancock ML et al. Insulin Receptor Associates with Promoters Genome-wide and Regulates Gene Expression. Cell 177, 722–736 e722 (2019). [DOI] [PMC free article] [PubMed] [Google Scholar]
- 38.Tu X et al. PD-L1 (B7-H1) Competes with the RNA Exosome to Regulate the DNA Damage Response and Can Be Targeted to Sensitize to Radiation or Chemotherapy. Mol Cell 74, 1215–1226 e1214 (2019). [DOI] [PMC free article] [PubMed] [Google Scholar]
- 39.Zou W, Wolchok JD & Chen L PD-L1 (B7-H1) and PD-1 pathway blockade for cancer therapy: Mechanisms, response biomarkers, and combinations. Sci Transl Med 8, 328rv324 (2016). [DOI] [PMC free article] [PubMed] [Google Scholar]
- 40.He G & Karin M NF-kappaB and STAT3 - key players in liver inflammation and cancer. Cell Res 21, 159–168 (2011). [DOI] [PMC free article] [PubMed] [Google Scholar]
- 41.Ceeraz S, Nowak EC & Noelle RJ B7 family checkpoint regulators in immune regulation and disease. Trends Immunol 34, 556–563 (2013). [DOI] [PMC free article] [PubMed] [Google Scholar]
- 42.Bertrand F et al. TNFalpha blockade overcomes resistance to anti-PD-1 in experimental melanoma. Nat Commun 8, 2256 (2017). [DOI] [PMC free article] [PubMed] [Google Scholar]
- 43.Perez-Ruiz E et al. Prophylactic TNF blockade uncouples efficacy and toxicity in dual CTLA-4 and PD-1 immunotherapy. Nature 569, 428–432 (2019). [DOI] [PubMed] [Google Scholar]
- 44.Azuma T et al. B7-H1 is a ubiquitous antiapoptotic receptor on cancer cells. Blood 111, 3635–3643 (2008). [DOI] [PMC free article] [PubMed] [Google Scholar]
- 45.Chang CH et al. Metabolic Competition in the Tumor Microenvironment Is a Driver of Cancer Progression. Cell 162, 1229–1241 (2015). [DOI] [PMC free article] [PubMed] [Google Scholar]
- 46.Patel SP & Kurzrock R PD-L1 Expression as a Predictive Biomarker in Cancer Immunotherapy. Mol Cancer Ther 14, 847–856 (2015). [DOI] [PubMed] [Google Scholar]
- 47.Nelson-Rees WA, Daniels DW & Flandermeyer RR Cross-contamination of cells in culture. Science 212, 446–452 (1981). [DOI] [PubMed] [Google Scholar]
- 48.Dai X et al. Prostate cancer-associated SPOP mutations confer resistance to BET inhibitors through stabilization of BRD4. Nat Med 23, 1063–1071 (2017). [DOI] [PMC free article] [PubMed] [Google Scholar]
- 49.Wei W et al. Degradation of the SCF component Skp2 in cell-cycle phase G1 by the anaphase-promoting complex. Nature 428, 194–198 (2004). [DOI] [PubMed] [Google Scholar]
- 50.Mahoney KM et al. PD-L1 Antibodies to Its Cytoplasmic Domain Most Clearly Delineate Cell Membranes in Immunohistochemical Staining of Tumor Cells. Cancer Immunol Res 3, 1308–1315 (2015). [DOI] [PMC free article] [PubMed] [Google Scholar]
- 51.Chaudhri A et al. PD-L1 Binds to B7–1 Only In Cis on the Same Cell Surface. Cancer Immunol Res 6, 921–929 (2018). [DOI] [PMC free article] [PubMed] [Google Scholar]
- 52.Liang SC et al. Regulation of PD-1, PD-L1, and PD-L2 expression during normal and autoimmune responses. Eur J Immunol 33, 2706–2716 (2003). [DOI] [PubMed] [Google Scholar]
- 53.Svendsen S, Zimprich C, McDougall MG, Klaubert DH & Los GV Spatial separation and bidirectional trafficking of proteins using a multi-functional reporter. BMC Cell Biol 9, 17 (2008). [DOI] [PMC free article] [PubMed] [Google Scholar]
- 54.Zeng H et al. Systematic identification of Ctr9 regulome in ERalpha-positive breast cancer. BMC Genomics 17, 902 (2016). [DOI] [PMC free article] [PubMed] [Google Scholar]
- 55.Langmead B & Salzberg SL Fast gapped-read alignment with Bowtie 2. Nat Methods 9, 357–359 (2012). [DOI] [PMC free article] [PubMed] [Google Scholar]
- 56.Zhang Y et al. Model-based analysis of ChIP-Seq (MACS). Genome Biol 9, R137 (2008). [DOI] [PMC free article] [PubMed] [Google Scholar]
- 57.McLean CY et al. GREAT improves functional interpretation of cis-regulatory regions. Nat Biotechnol 28, 495–501 (2010). [DOI] [PMC free article] [PubMed] [Google Scholar]
- 58.Huang W, Loganantharaj R, Schroeder B, Fargo D & Li L PAVIS: a tool for Peak Annotation and Visualization. Bioinformatics 29, 3097–3099 (2013). [DOI] [PMC free article] [PubMed] [Google Scholar]
- 59.Ramirez F, Dundar F, Diehl S, Gruning BA & Manke T deepTools: a flexible platform for exploring deep-sequencing data. Nucleic Acids Res 42, W187–191 (2014). [DOI] [PMC free article] [PubMed] [Google Scholar]
- 60.Zhou Y et al. Metascape provides a biologist-oriented resource for the analysis of systems-level datasets. Nat Commun 10, 1523 (2019). [DOI] [PMC free article] [PubMed] [Google Scholar]
- 61.Dobin A et al. STAR: ultrafast universal RNA-seq aligner. Bioinformatics 29, 15–21 (2013). [DOI] [PMC free article] [PubMed] [Google Scholar]
- 62.Trapnell C et al. Differential gene and transcript expression analysis of RNA-seq experiments with TopHat and Cufflinks. Nat Protoc 7, 562–578 (2012). [DOI] [PMC free article] [PubMed] [Google Scholar]
- 63.Huang da W, Sherman BT & Lempicki RA Systematic and integrative analysis of large gene lists using DAVID bioinformatics resources. Nat Protoc 4, 44–57 (2009). [DOI] [PubMed] [Google Scholar]
- 64.Huang da W, Sherman BT & Lempicki RA Bioinformatics enrichment tools: paths toward the comprehensive functional analysis of large gene lists. Nucleic Acids Res 37, 1–13 (2009). [DOI] [PMC free article] [PubMed] [Google Scholar]
- 65.Subramanian A et al. Gene set enrichment analysis: a knowledge-based approach for interpreting genome-wide expression profiles. Proc Natl Acad Sci U S A 102, 15545–15550 (2005). [DOI] [PMC free article] [PubMed] [Google Scholar]
- 66.Tang Z et al. GEPIA: a web server for cancer and normal gene expression profiling and interactive analyses. Nucleic Acids Res 45, W98–W102 (2017). [DOI] [PMC free article] [PubMed] [Google Scholar]
- 67.Jiang P et al. Signatures of T cell dysfunction and exclusion predict cancer immunotherapy response. Nat Med 24, 1550–1558 (2018). [DOI] [PMC free article] [PubMed] [Google Scholar]
- 68.Riaz N et al. Tumor and Microenvironment Evolution during Immunotherapy with Nivolumab. Cell 171, 934–949 e916 (2017). [DOI] [PMC free article] [PubMed] [Google Scholar]
Associated Data
This section collects any data citations, data availability statements, or supplementary materials included in this article.
Supplementary Materials
Data Availability Statement
The next generation sequencing (NGS) data generated in this study have been submitted to the Gene Expression Omnibus Database with accession number GSE134510, GSE146557 and GSE146648. The data from mass-spectrometric analysis was deposited in Japan Proteome Standard Repository/Database (JPOST) with the accession number: JPST000666/PXD015191 and JPST000757/PXD017707, respectively. The human cancer data were derived from the TCGA Research Network: http://cancergenome.nih.gov/, and Riaz2017_PD1 cohort68. The data-set derived from this resource that supports the findings of this study is available in GEPIA (http://gepia.cancer-pku.cn)66 and TIDE (http://tide.dfci.harvard.edu)67. Source data for Figs. 1–7 and Extended Data Figs. 1–7 are available online. All other data supporting the findings of this study are available from the corresponding author upon reasonable request.


